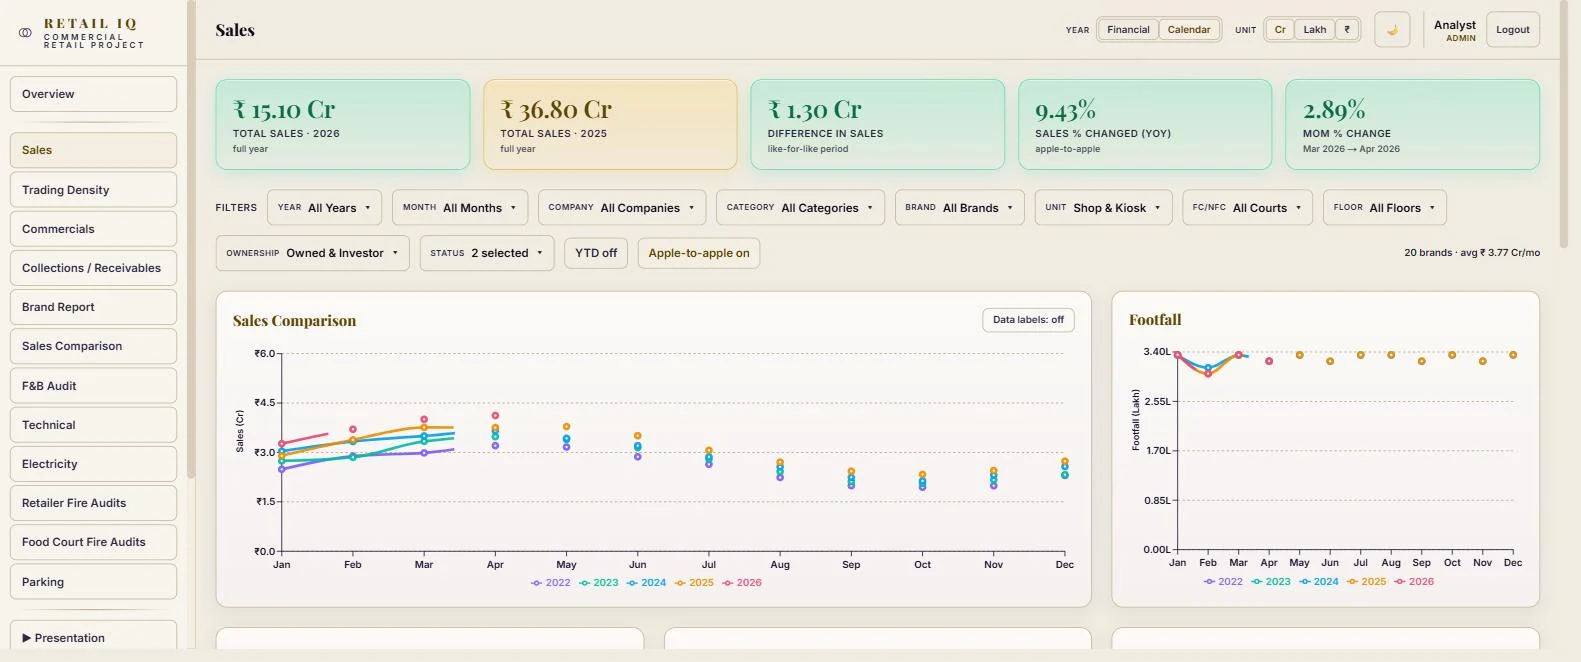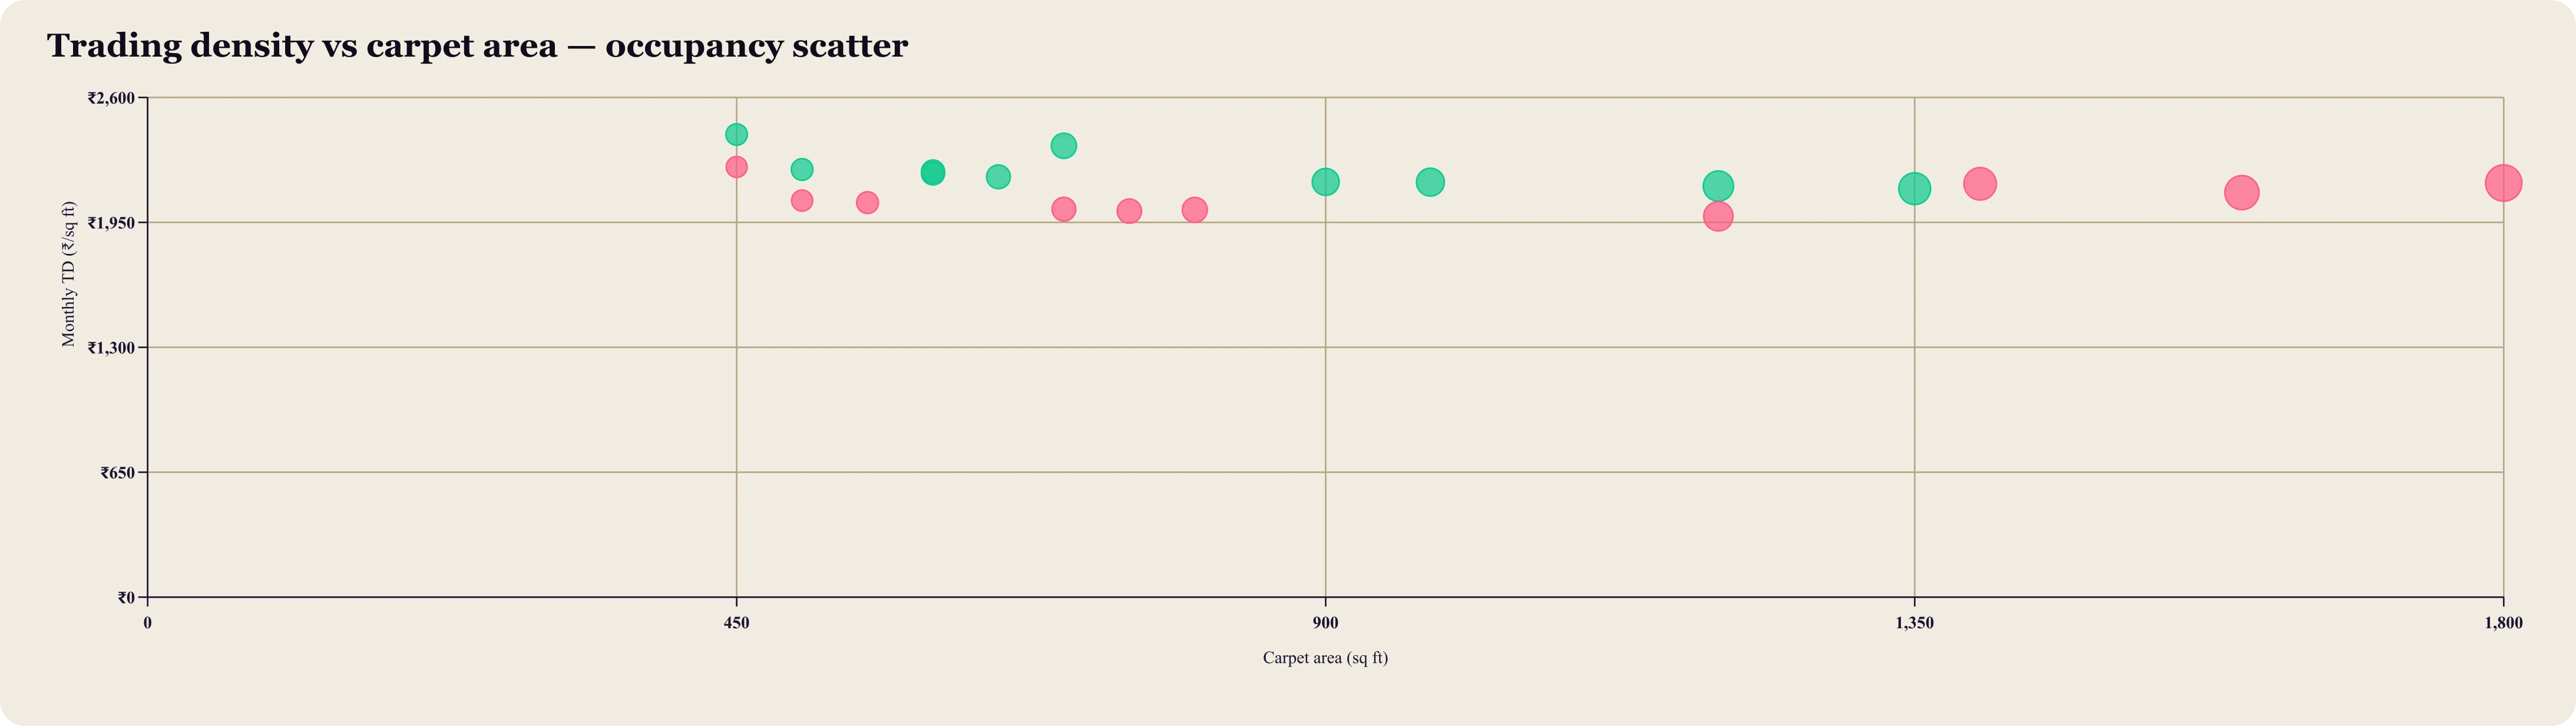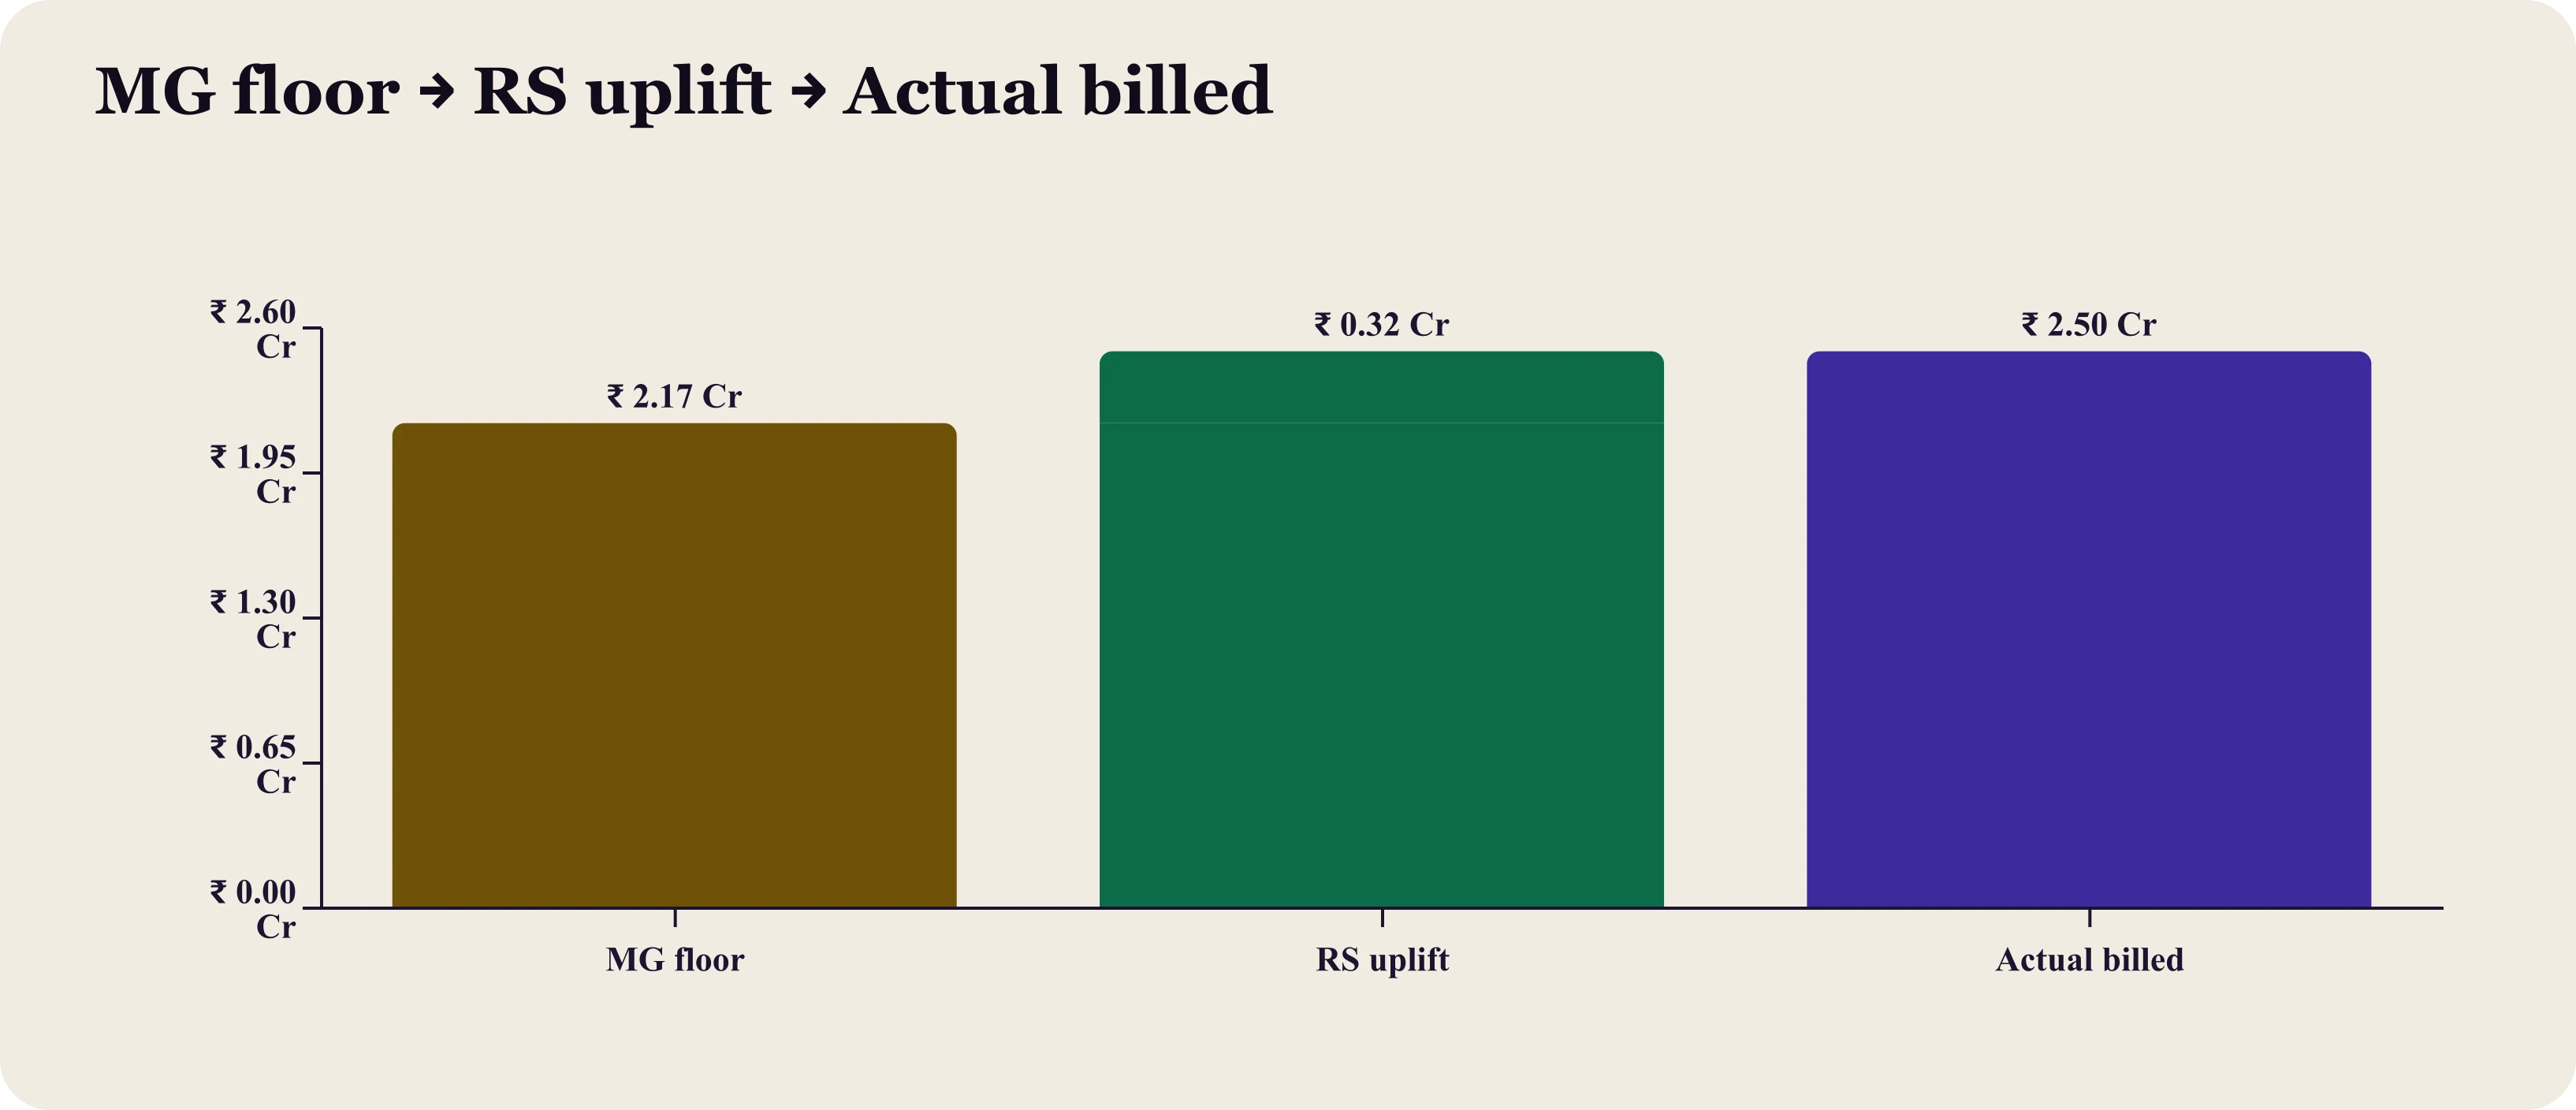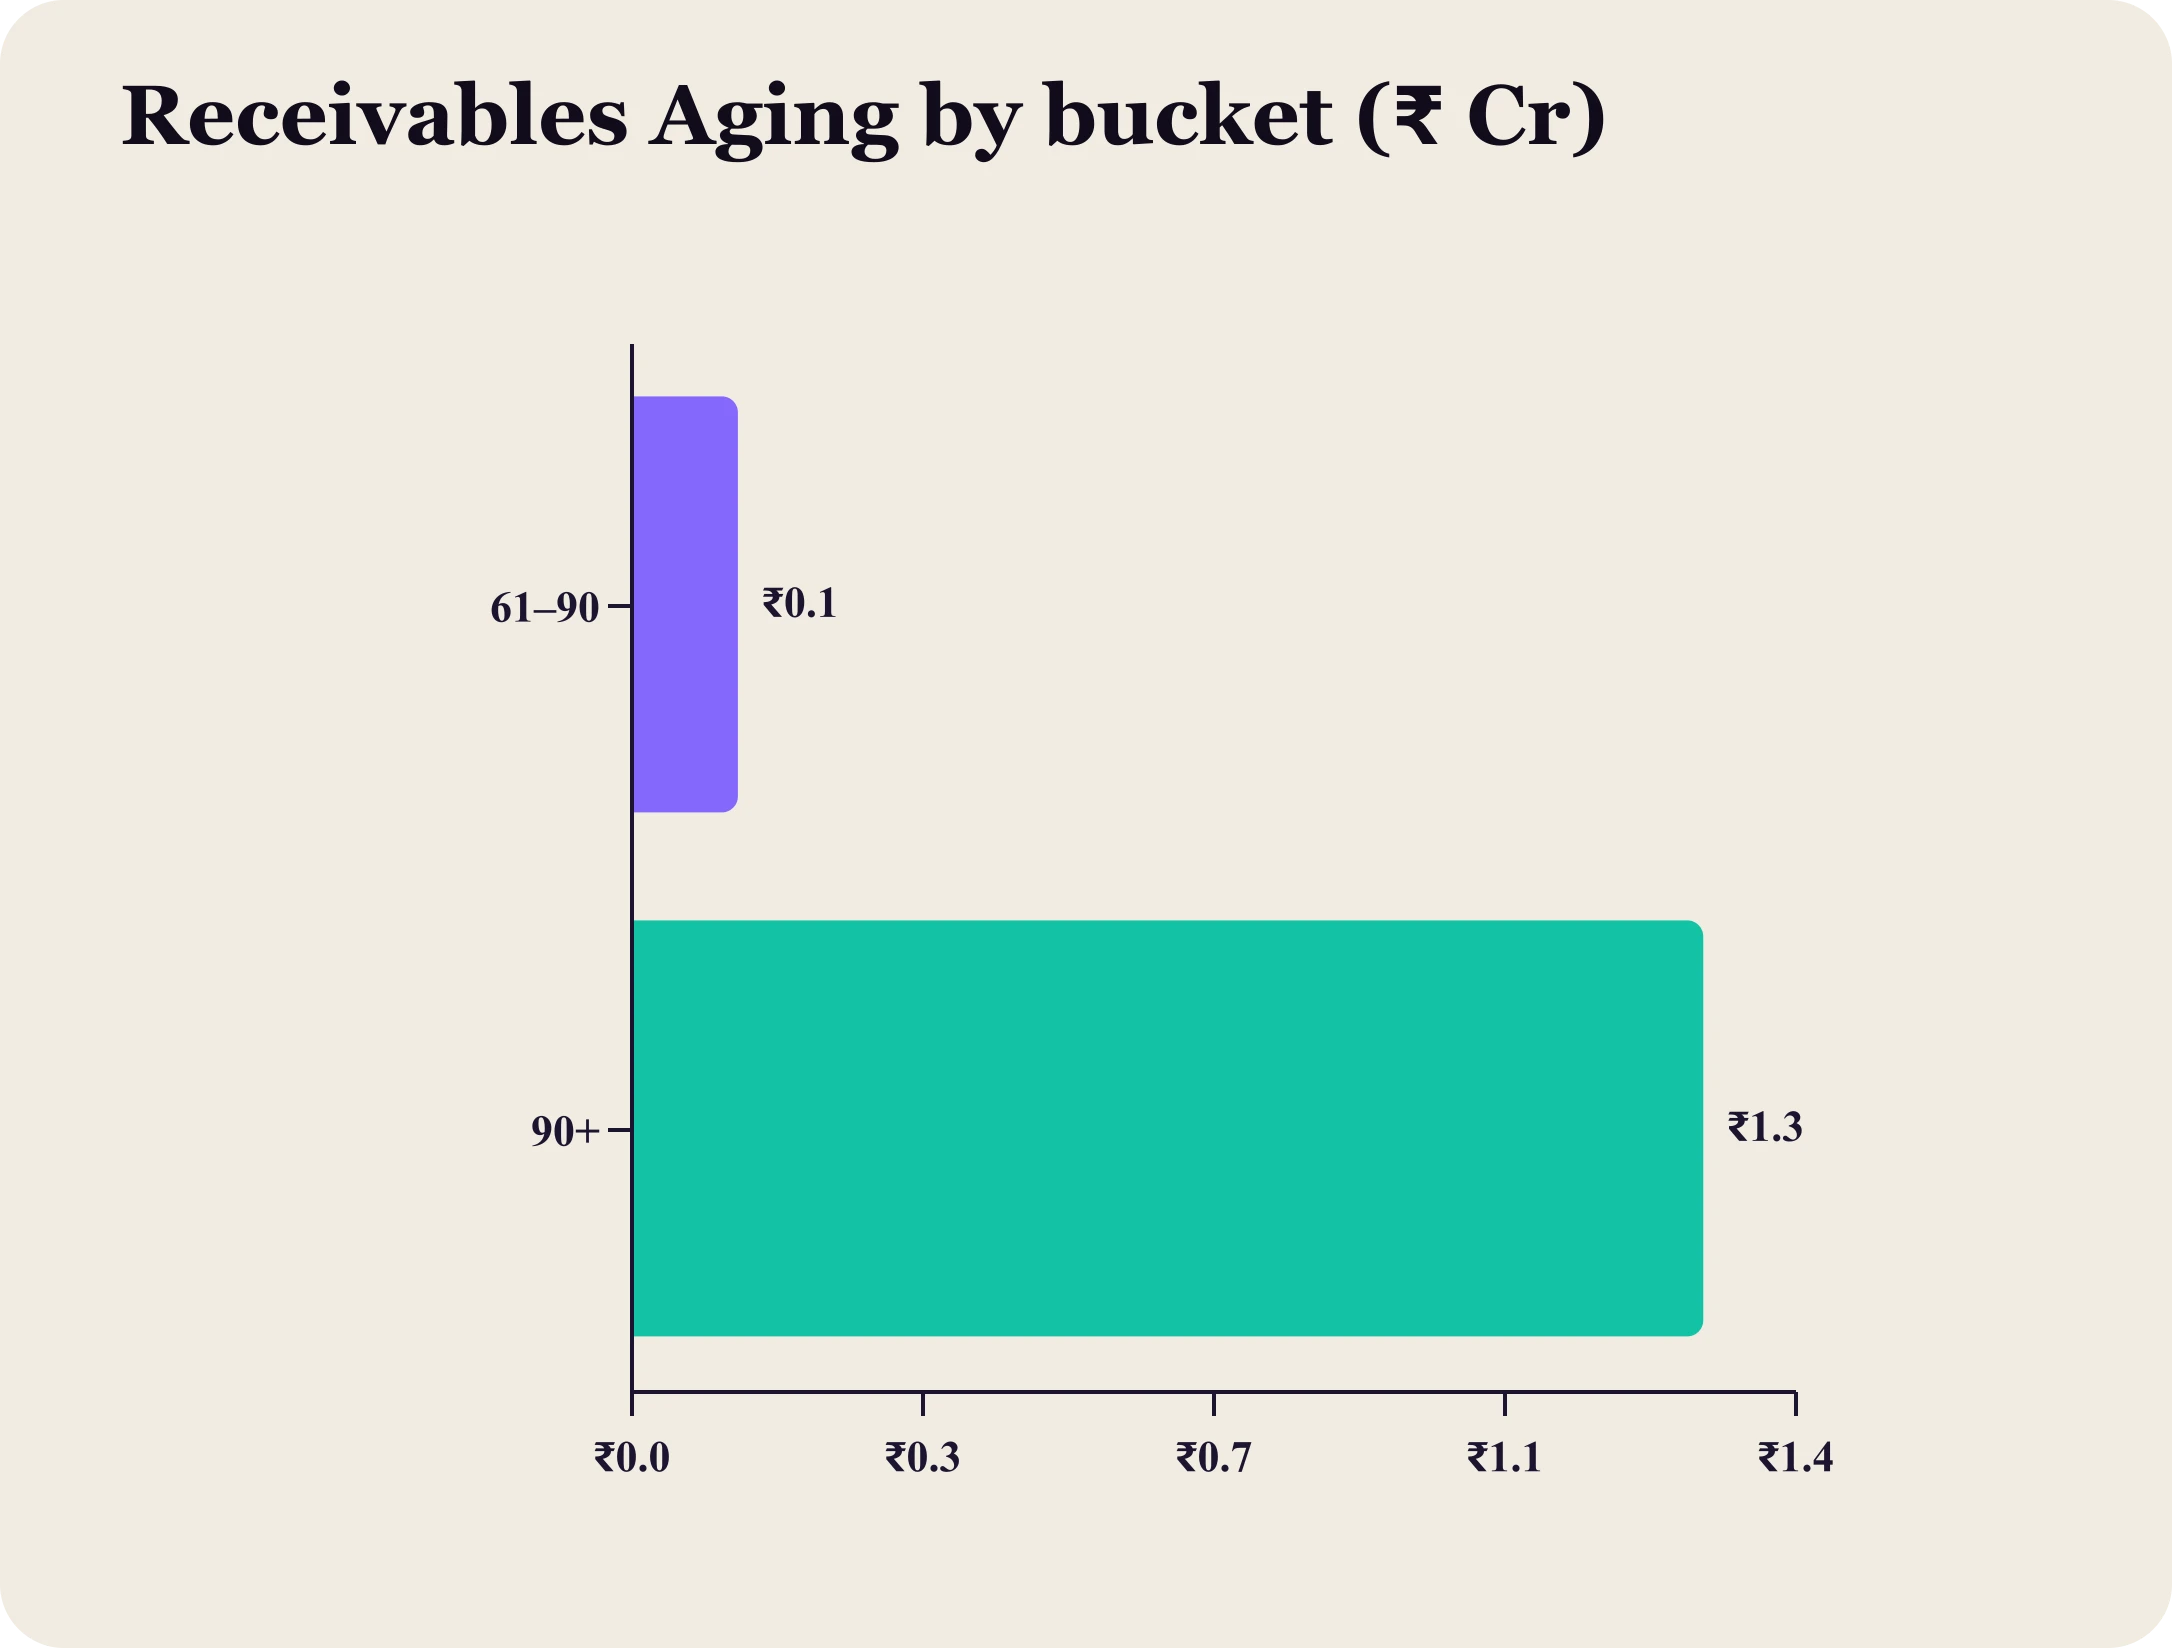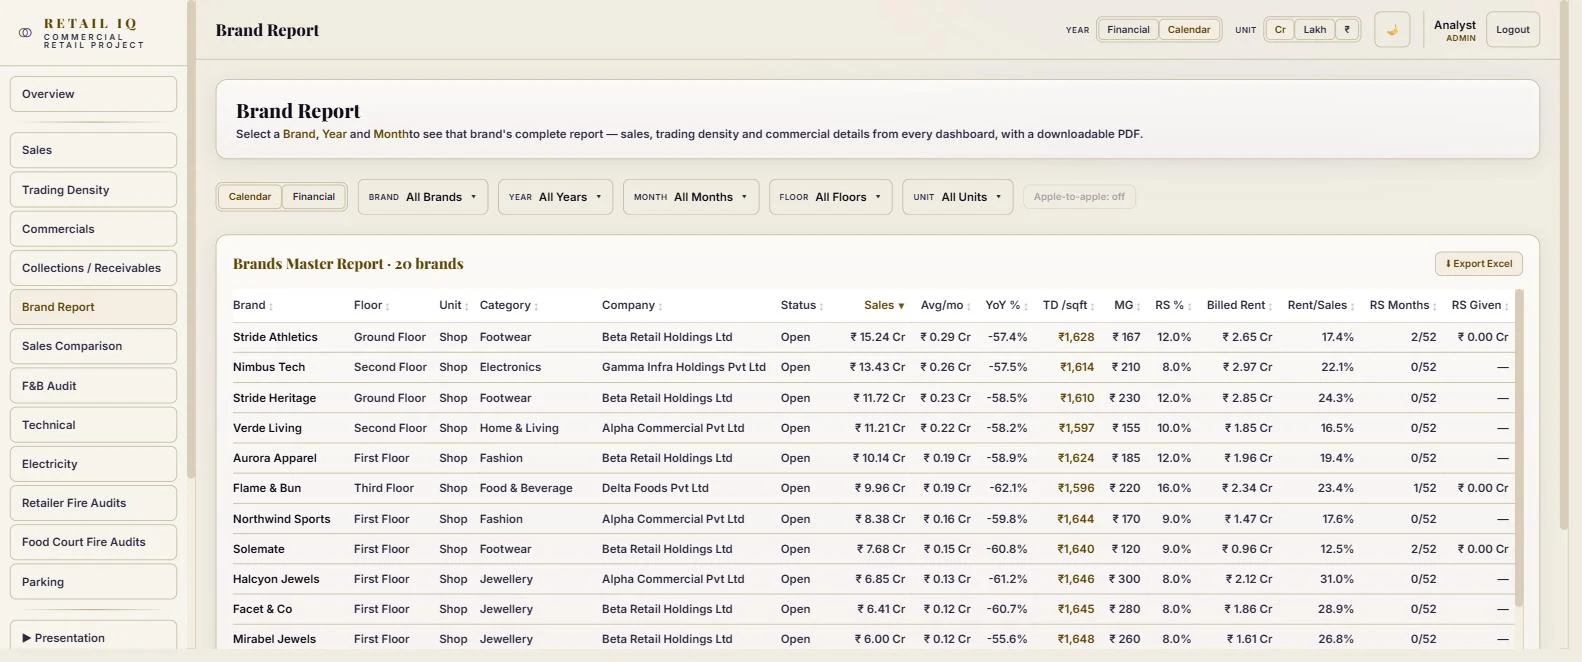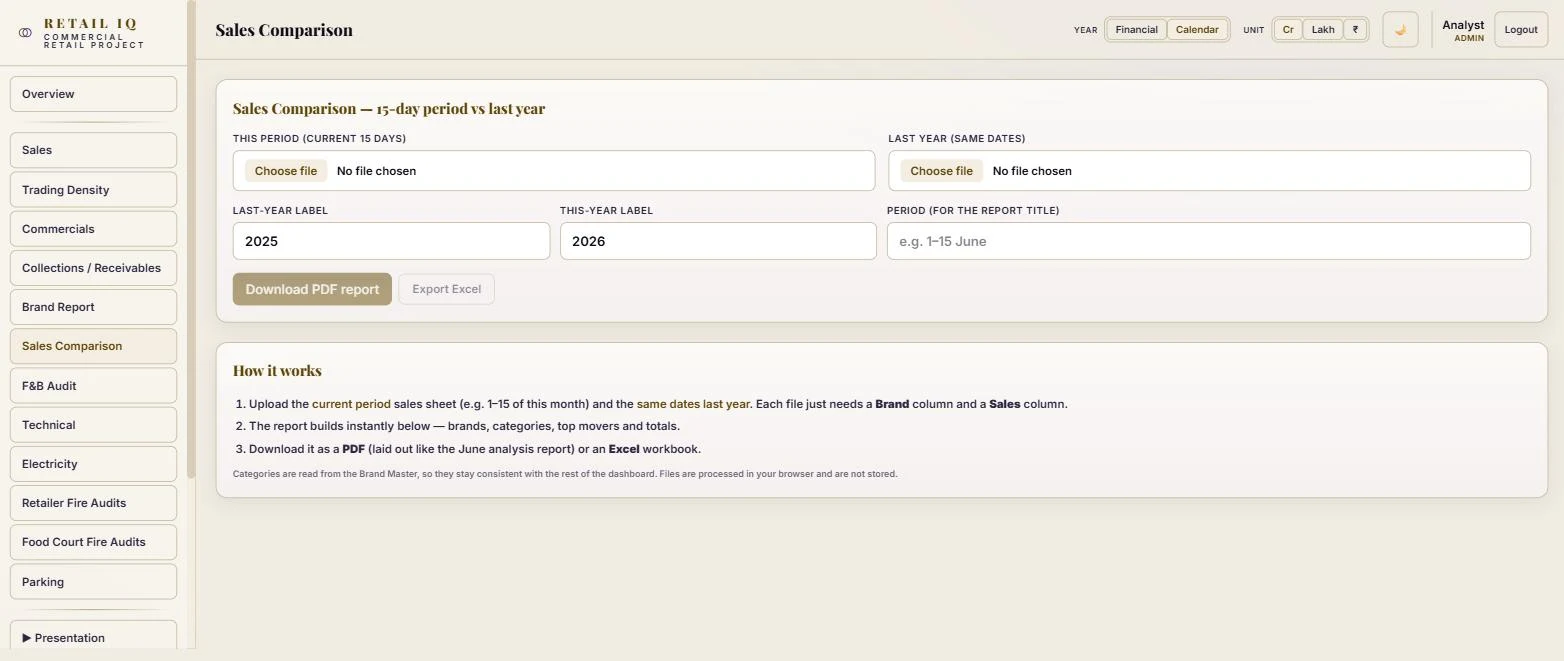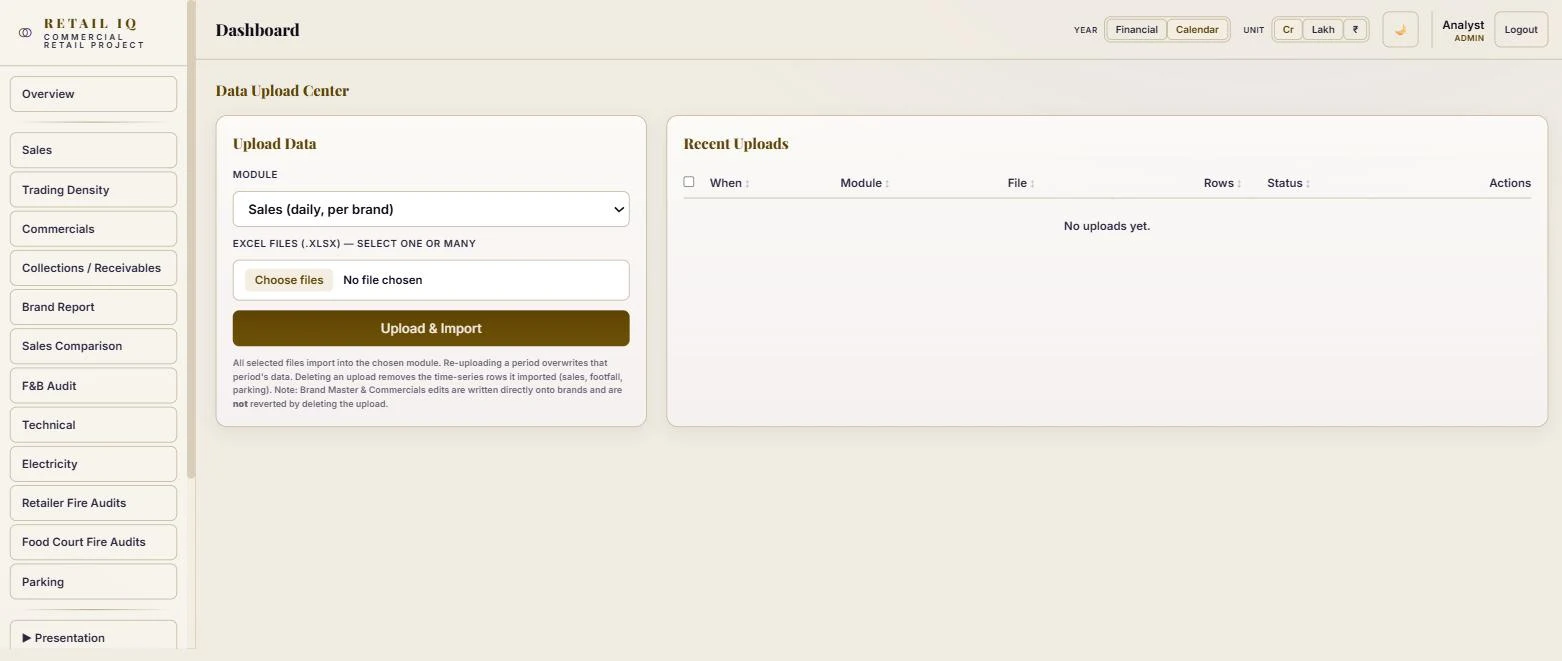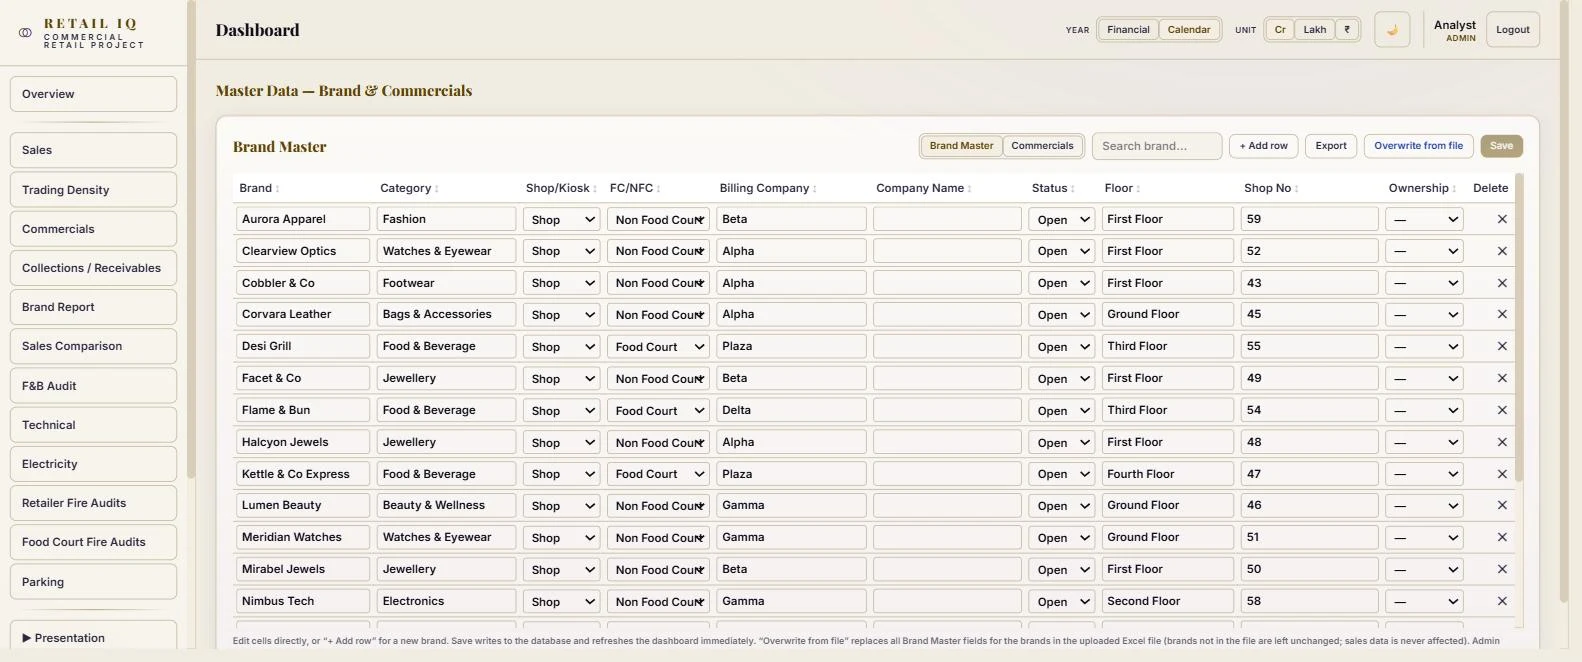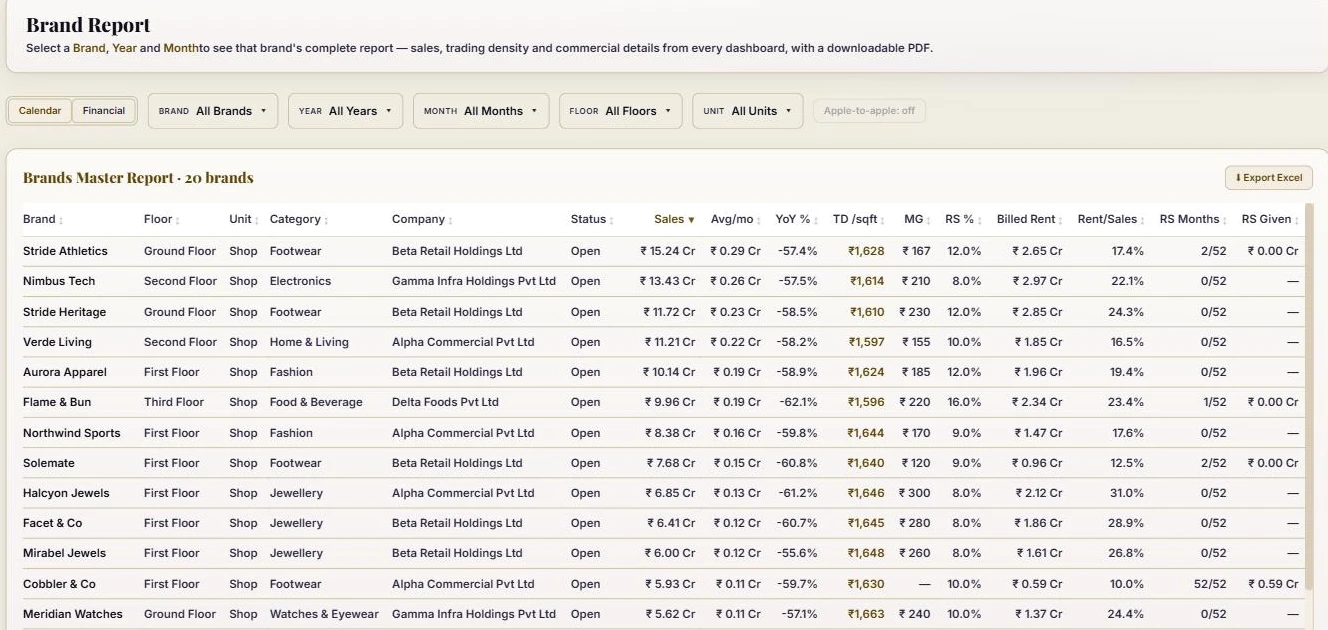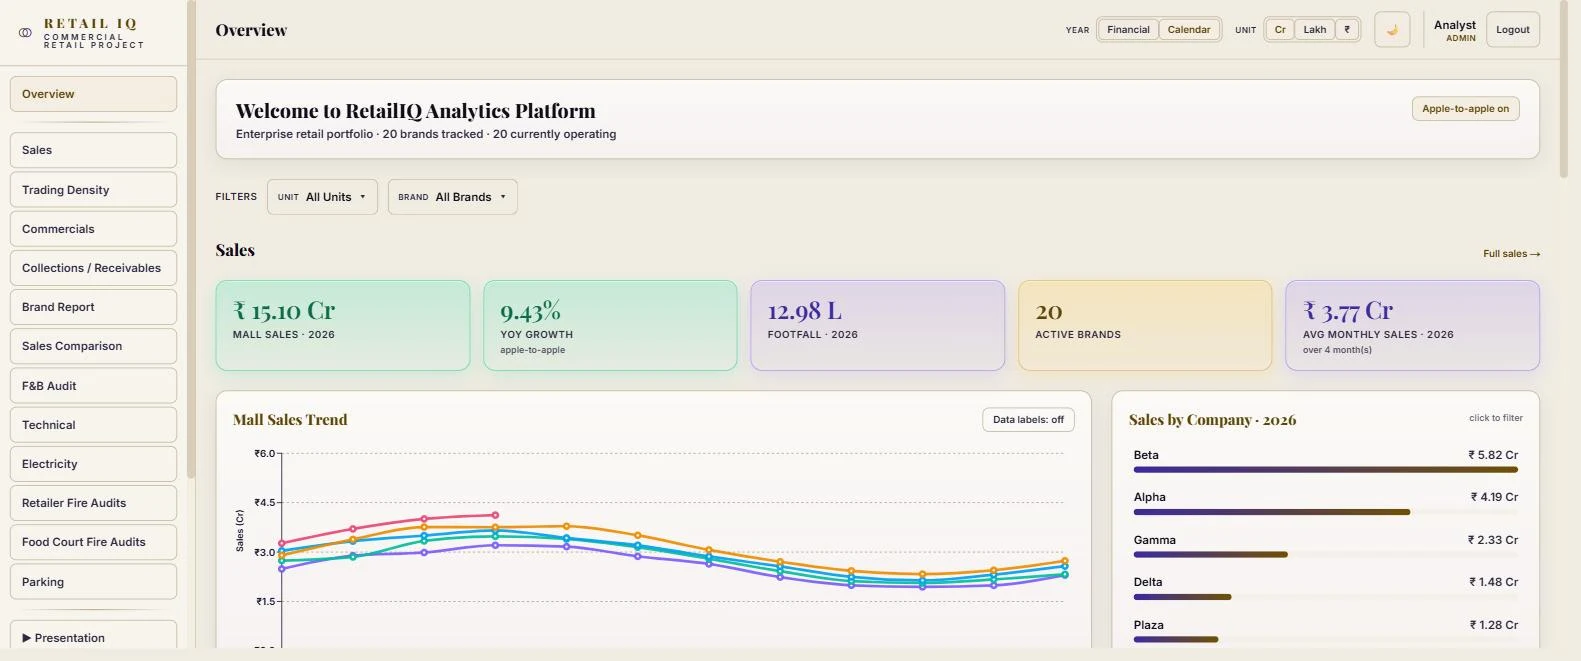
A single-screen state of the property
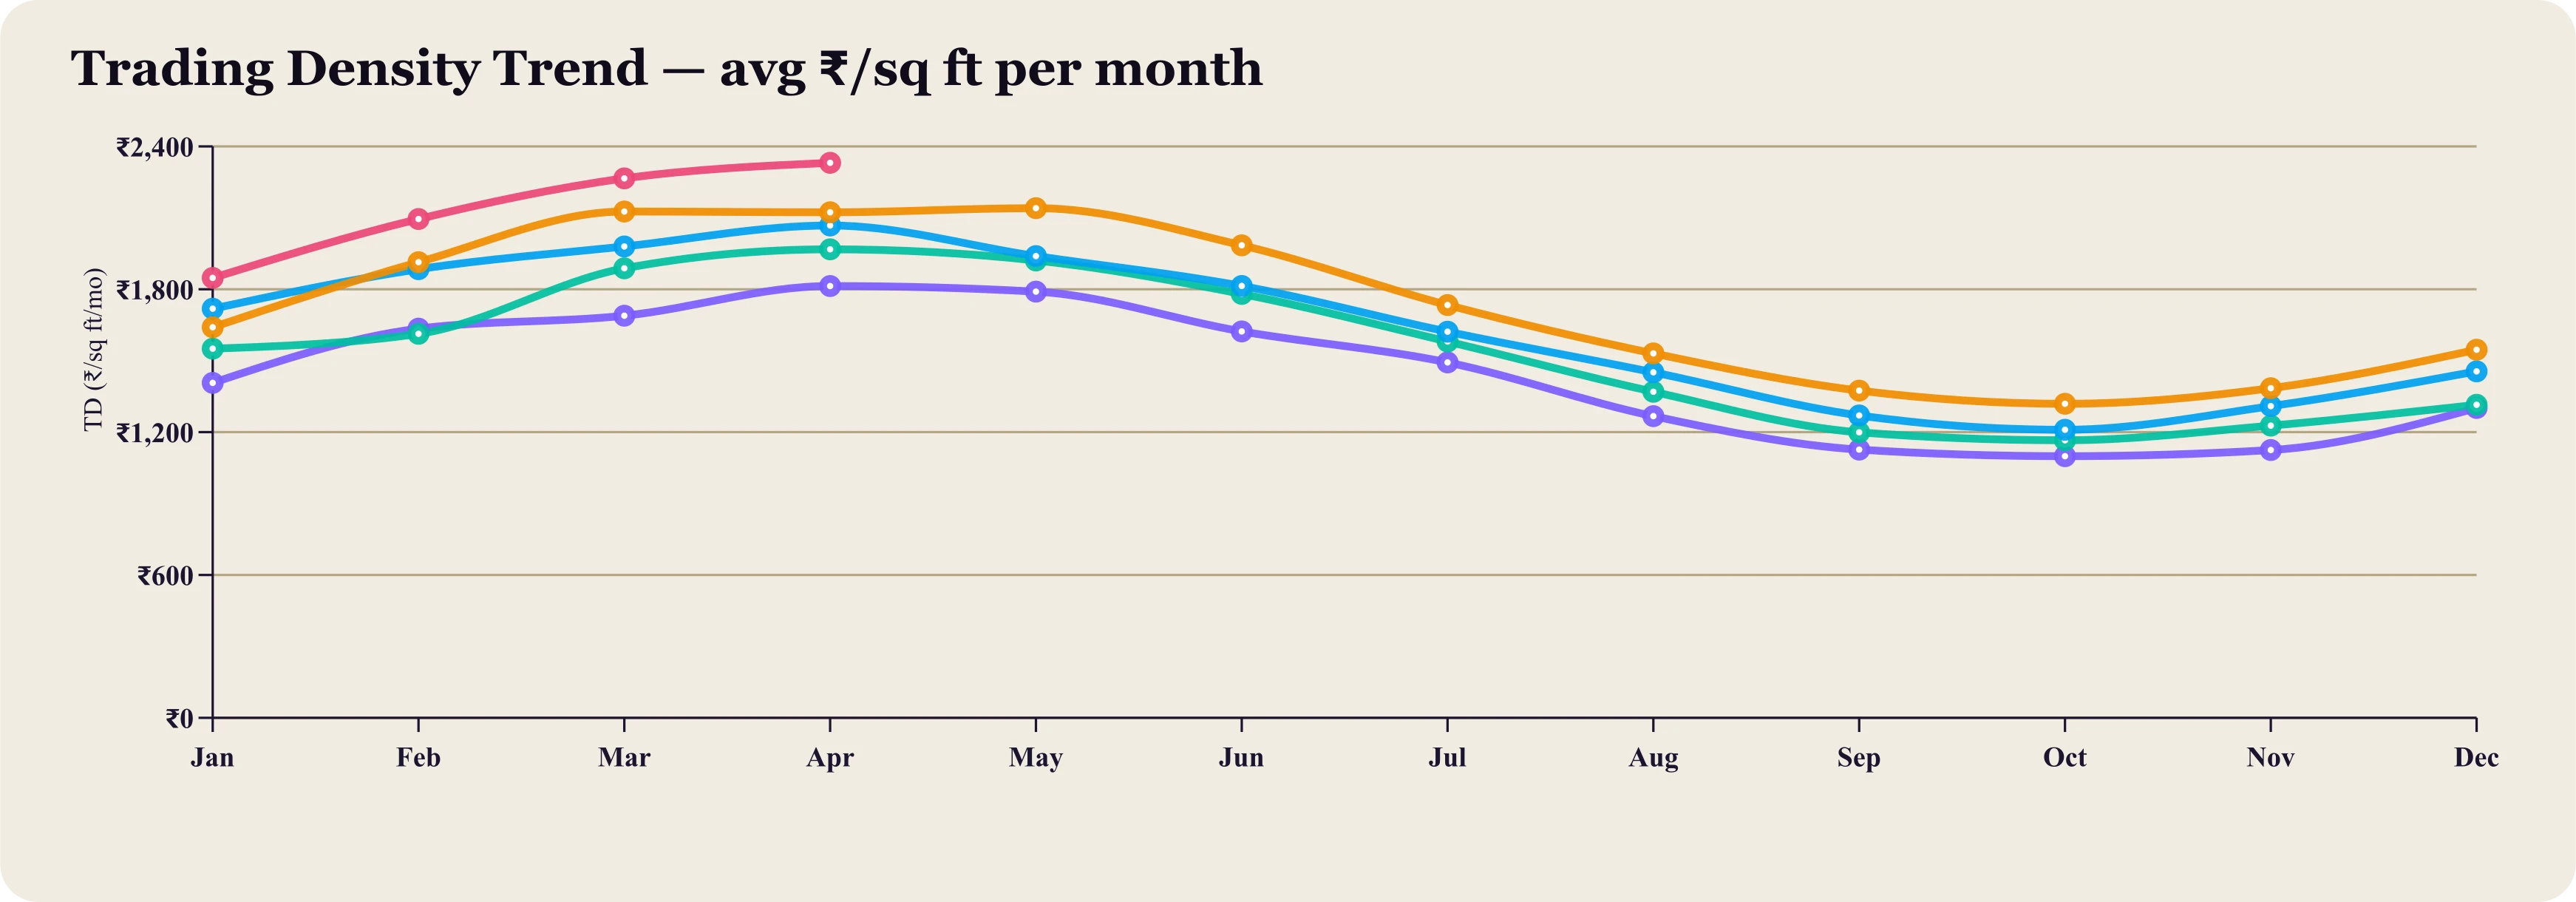
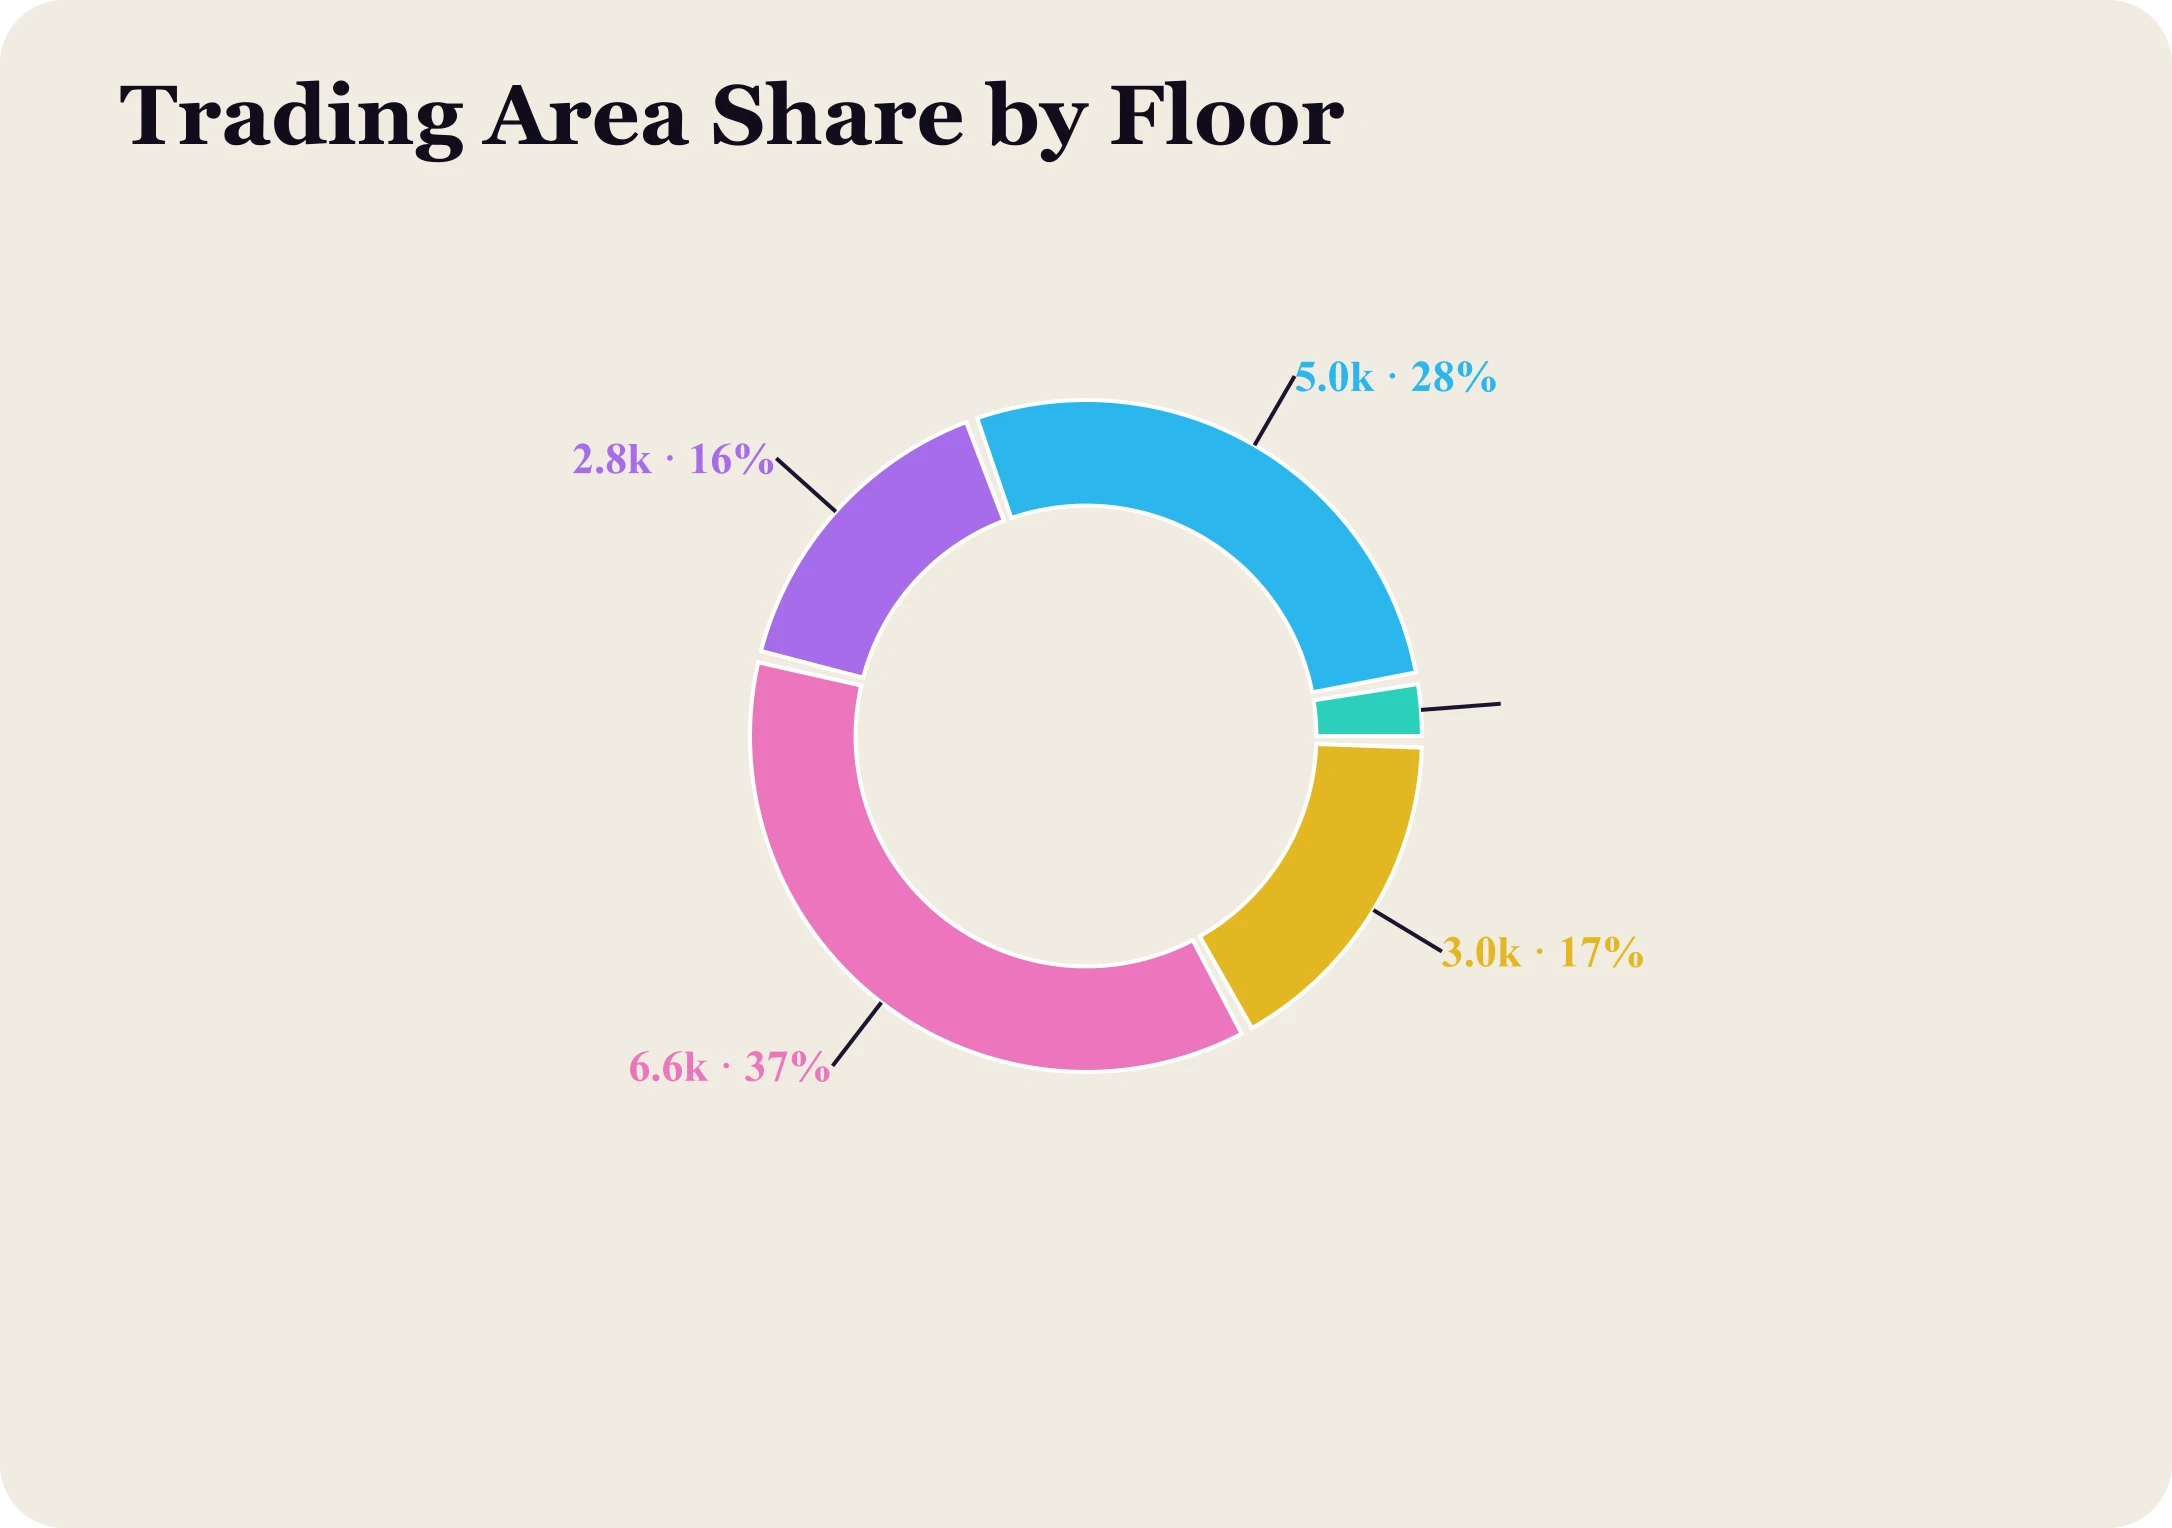
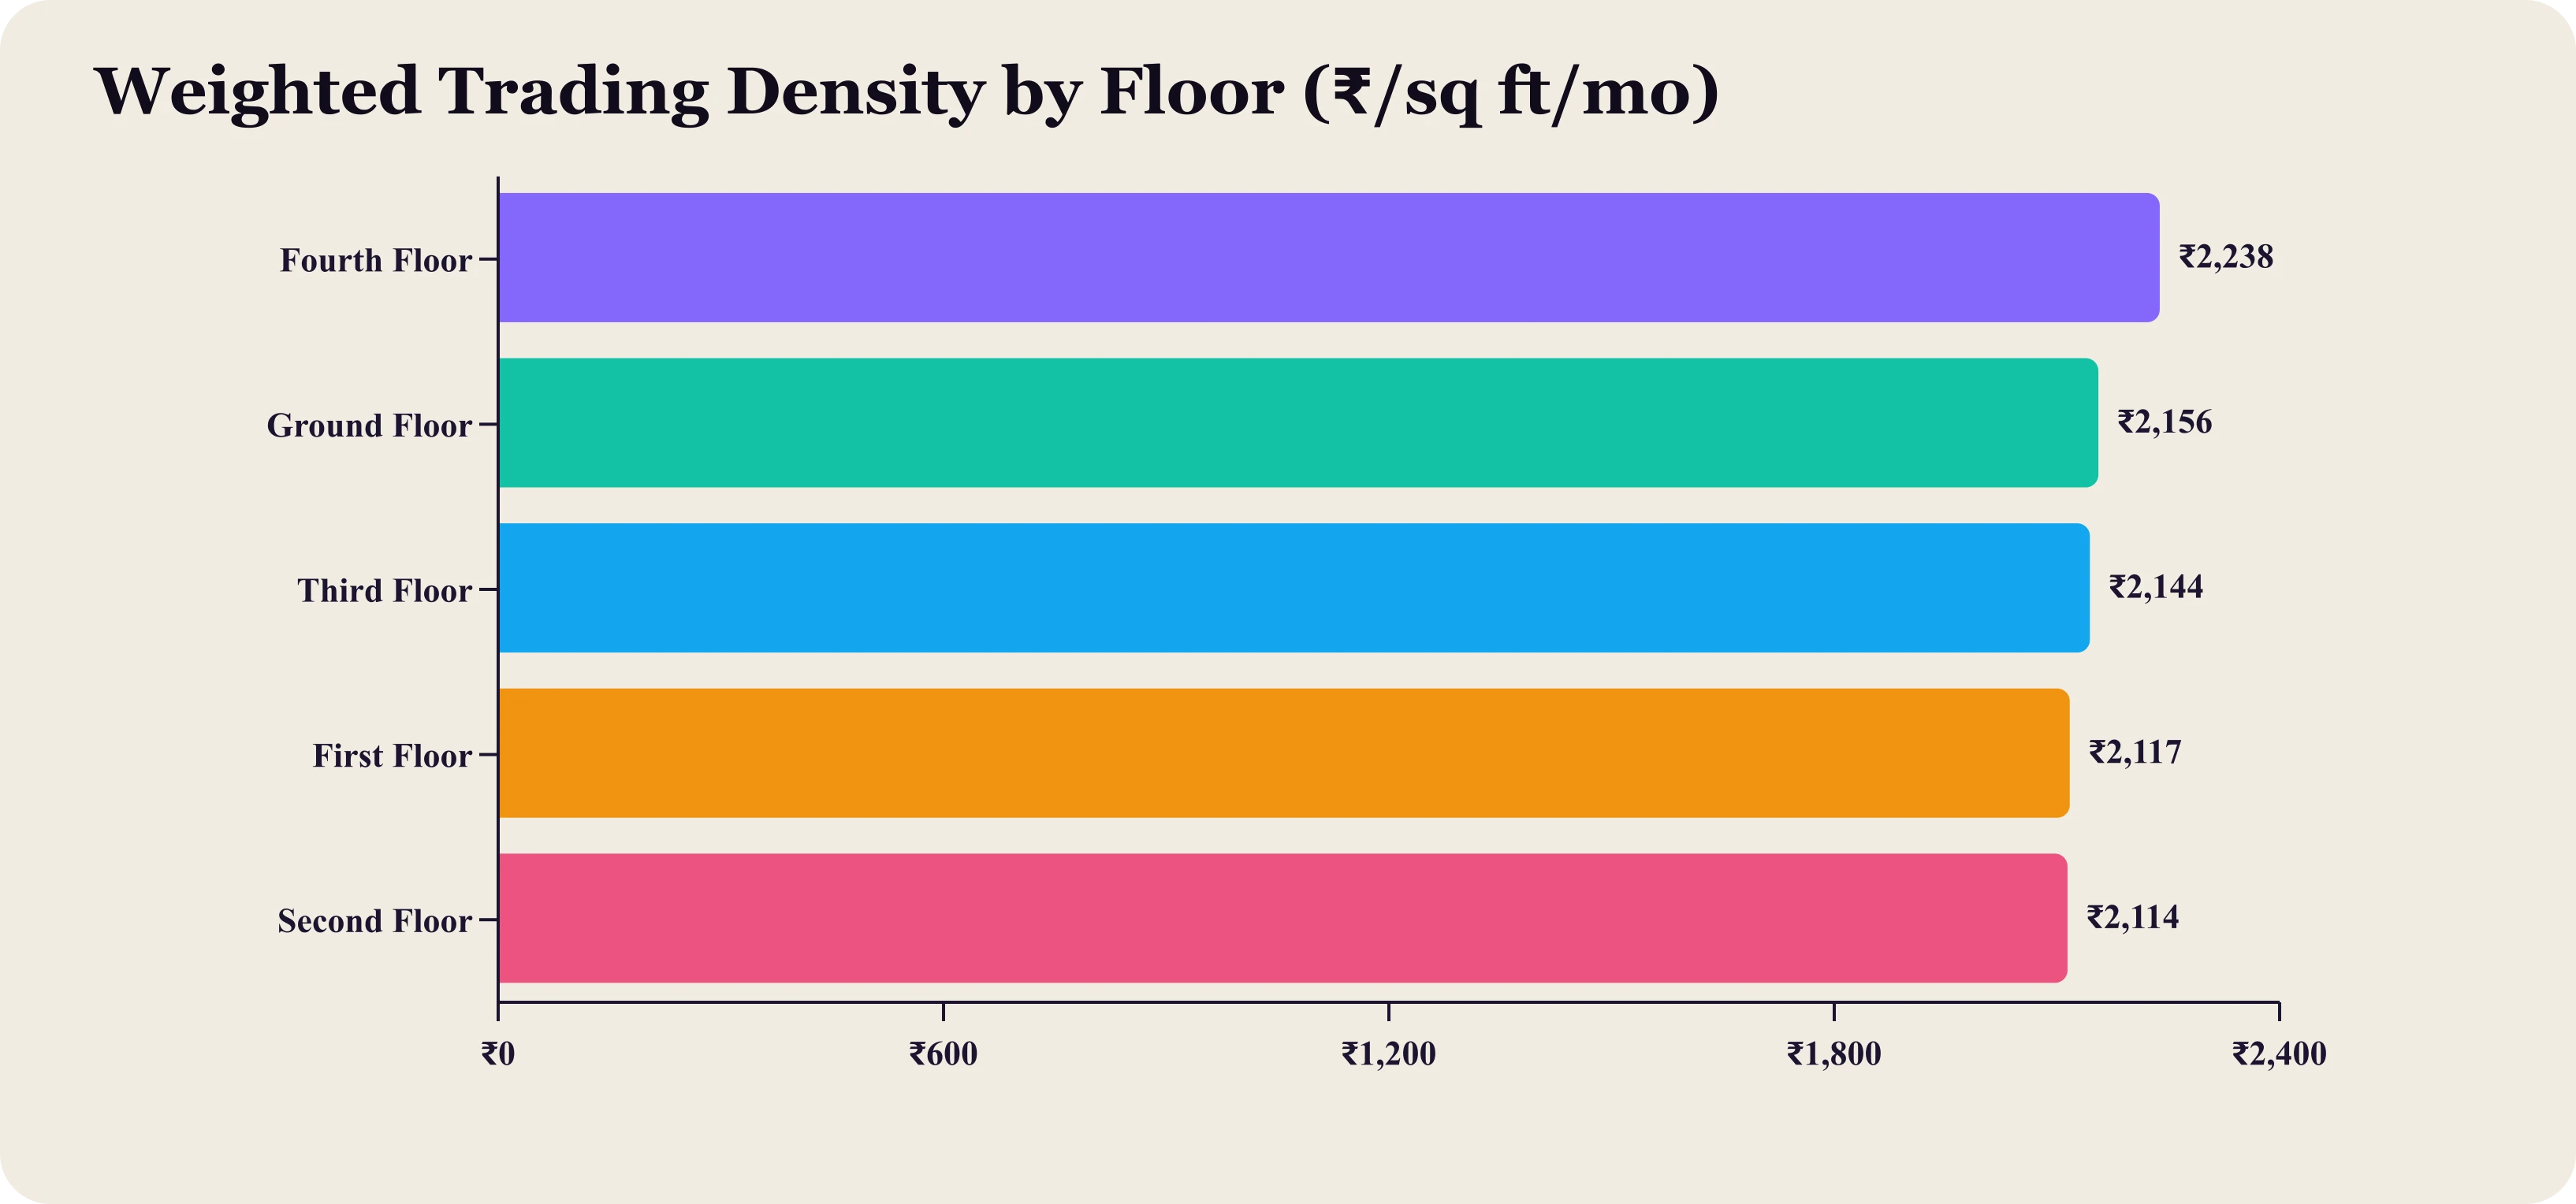
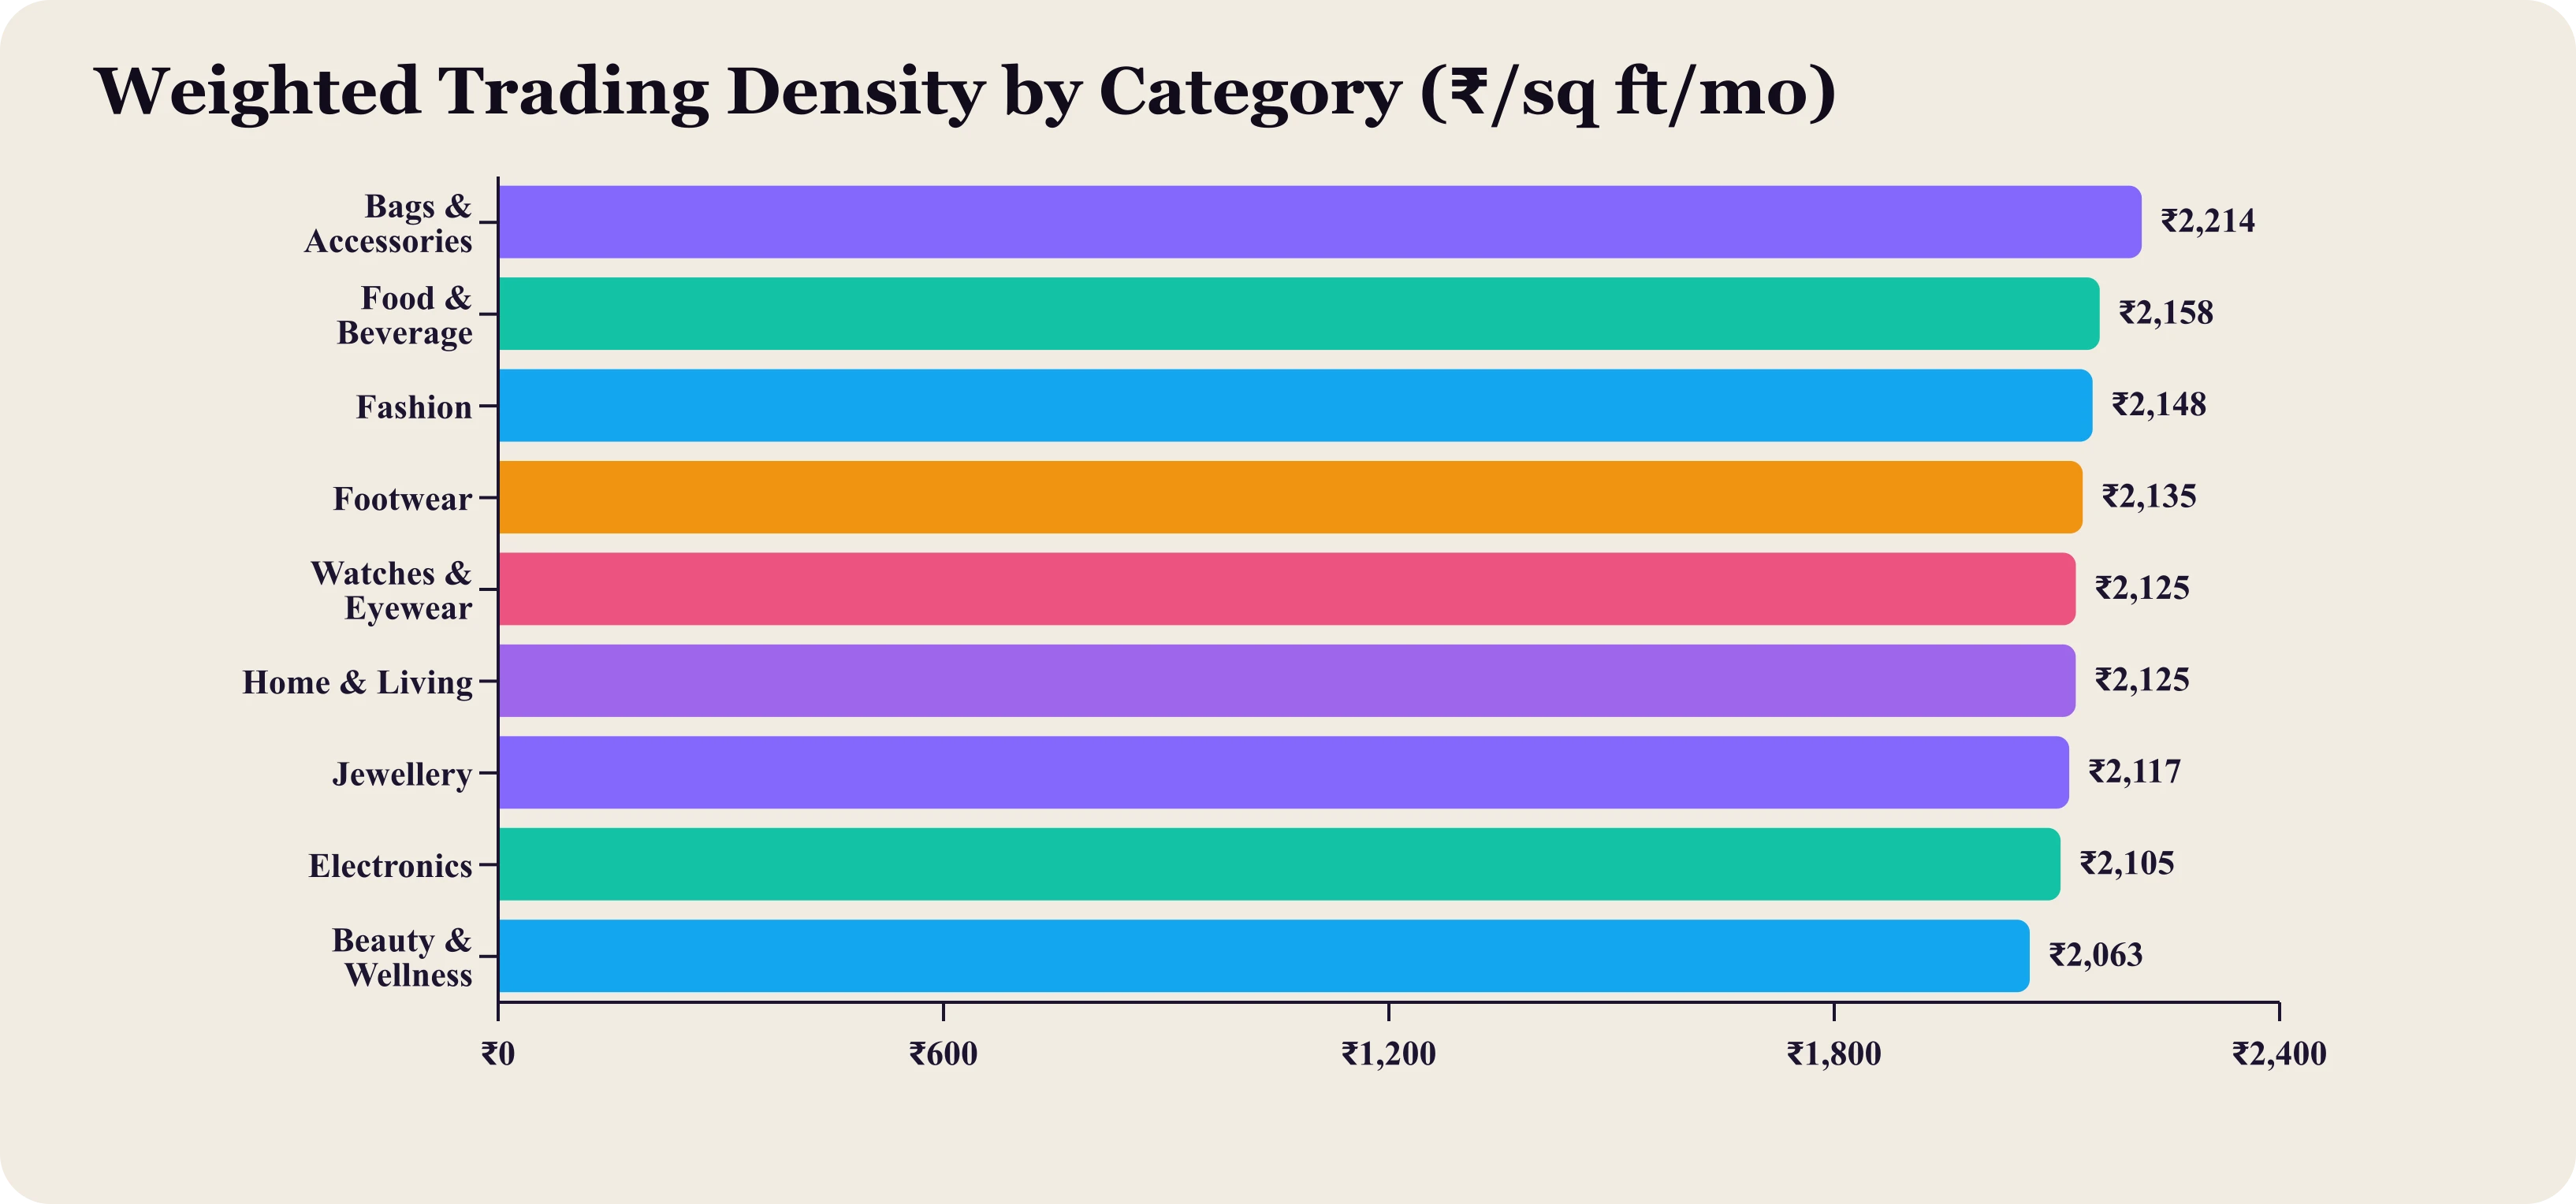
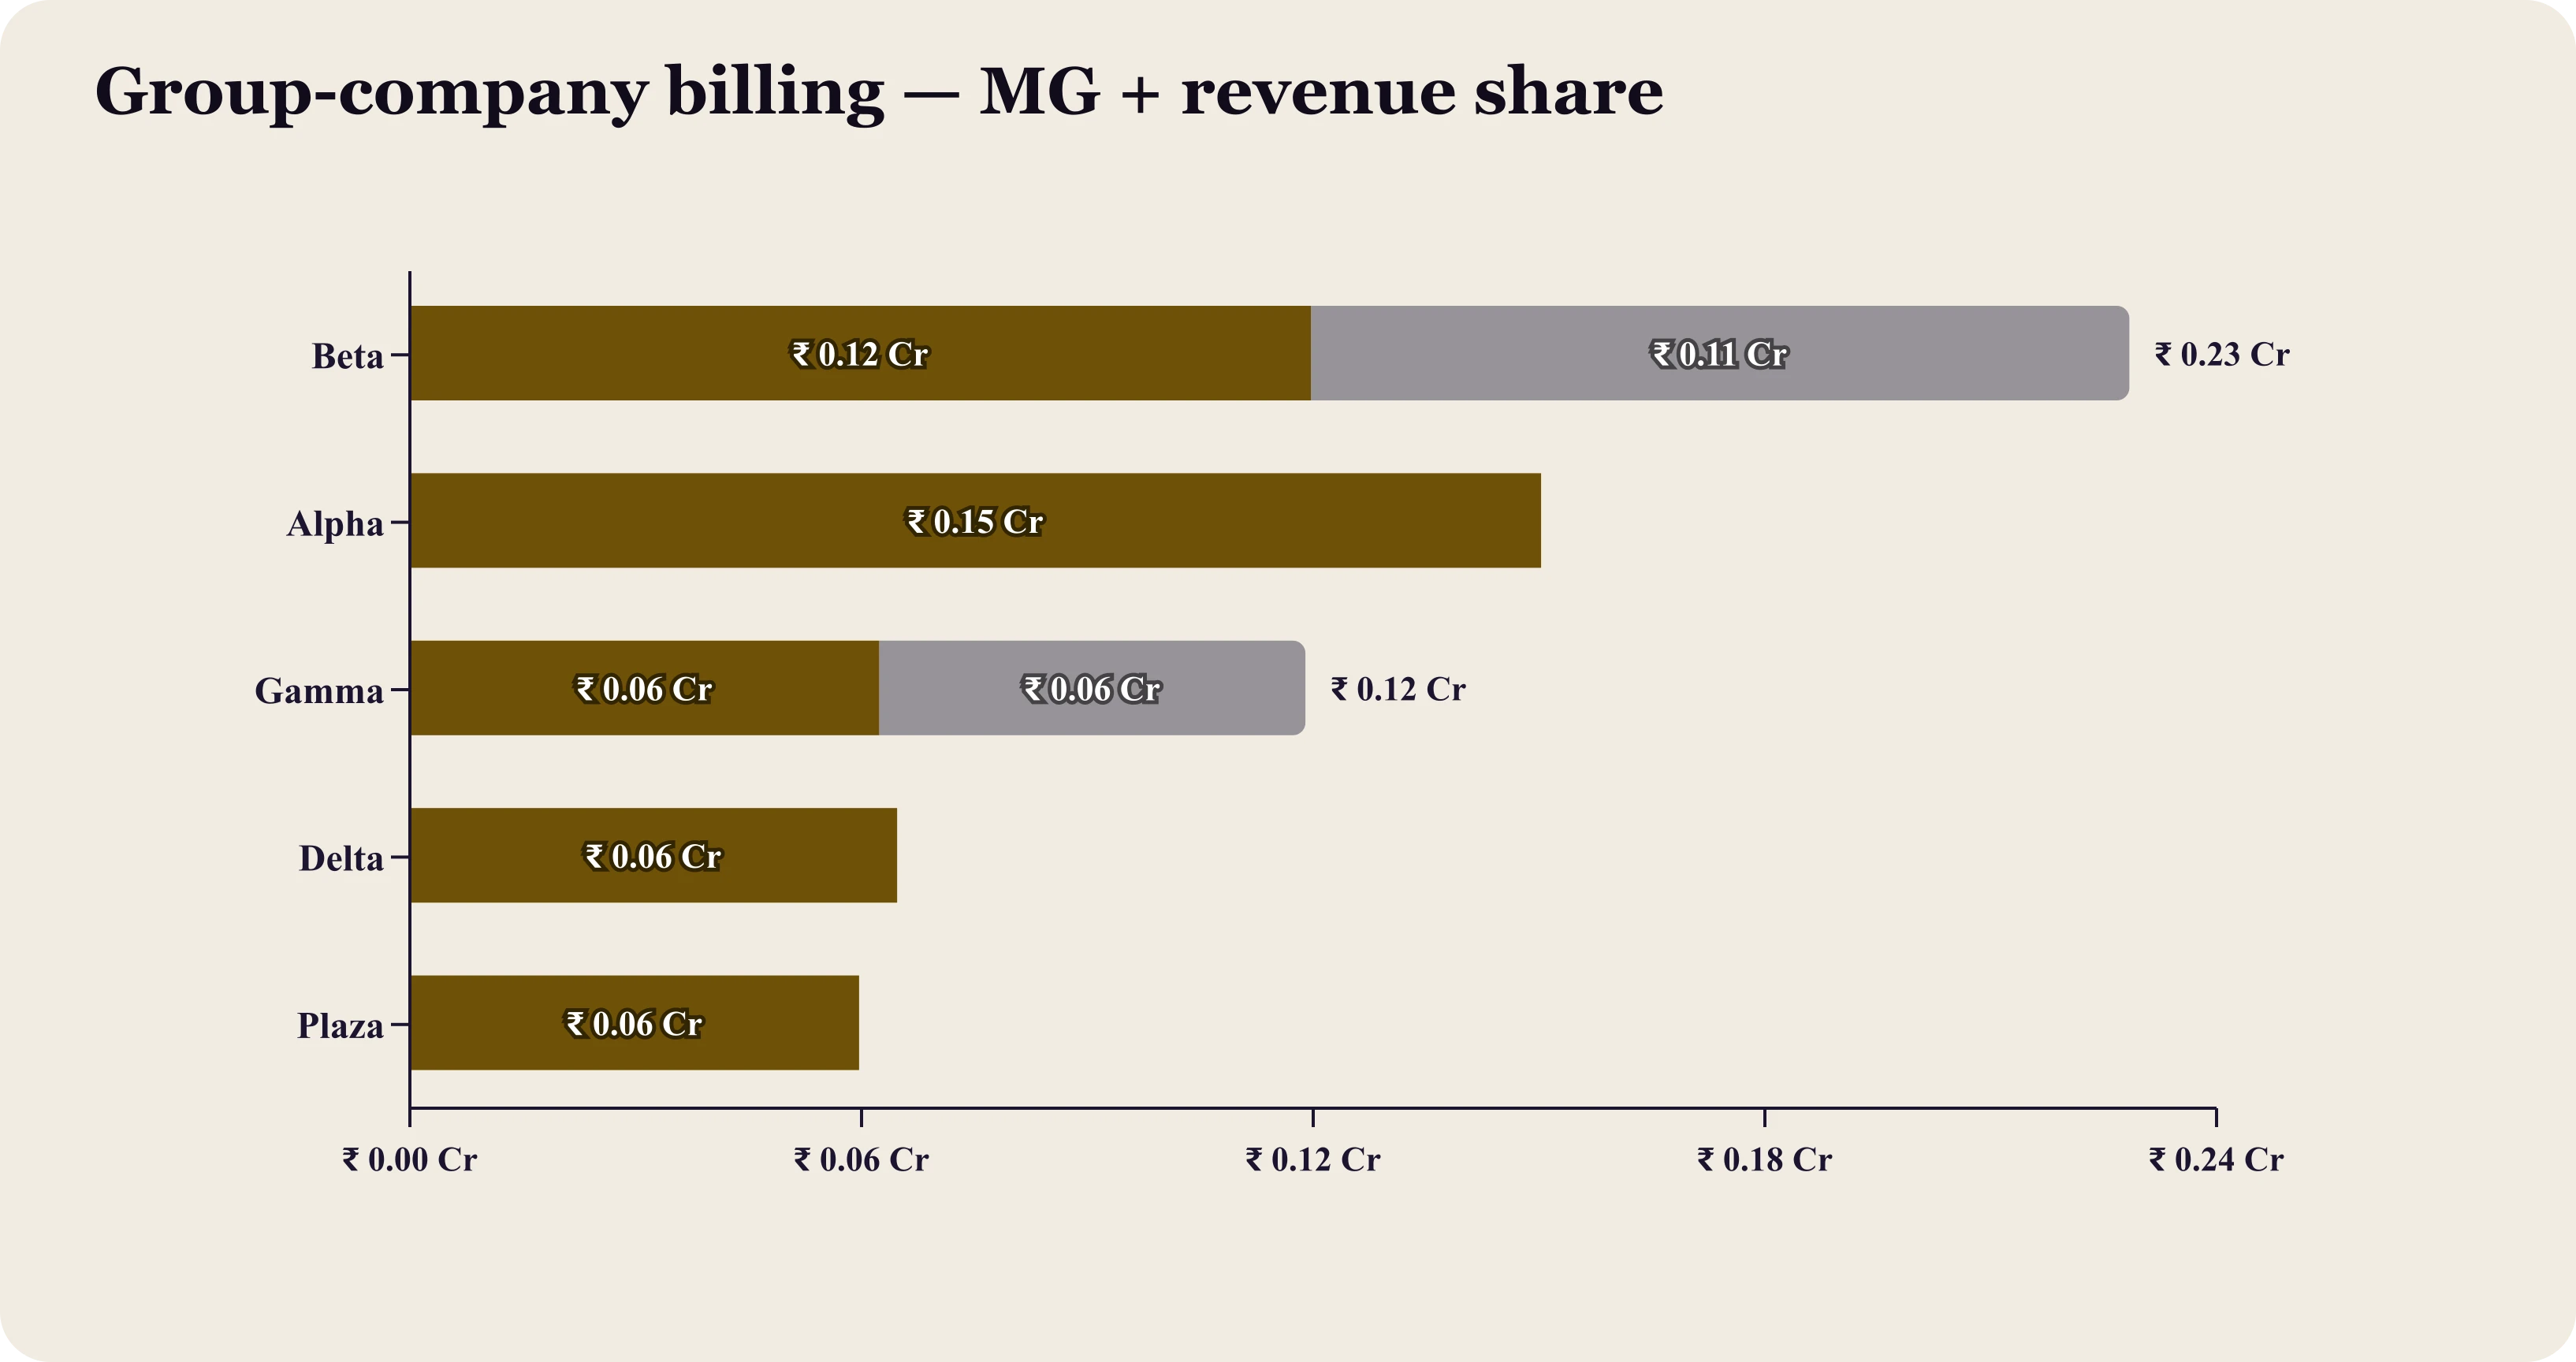
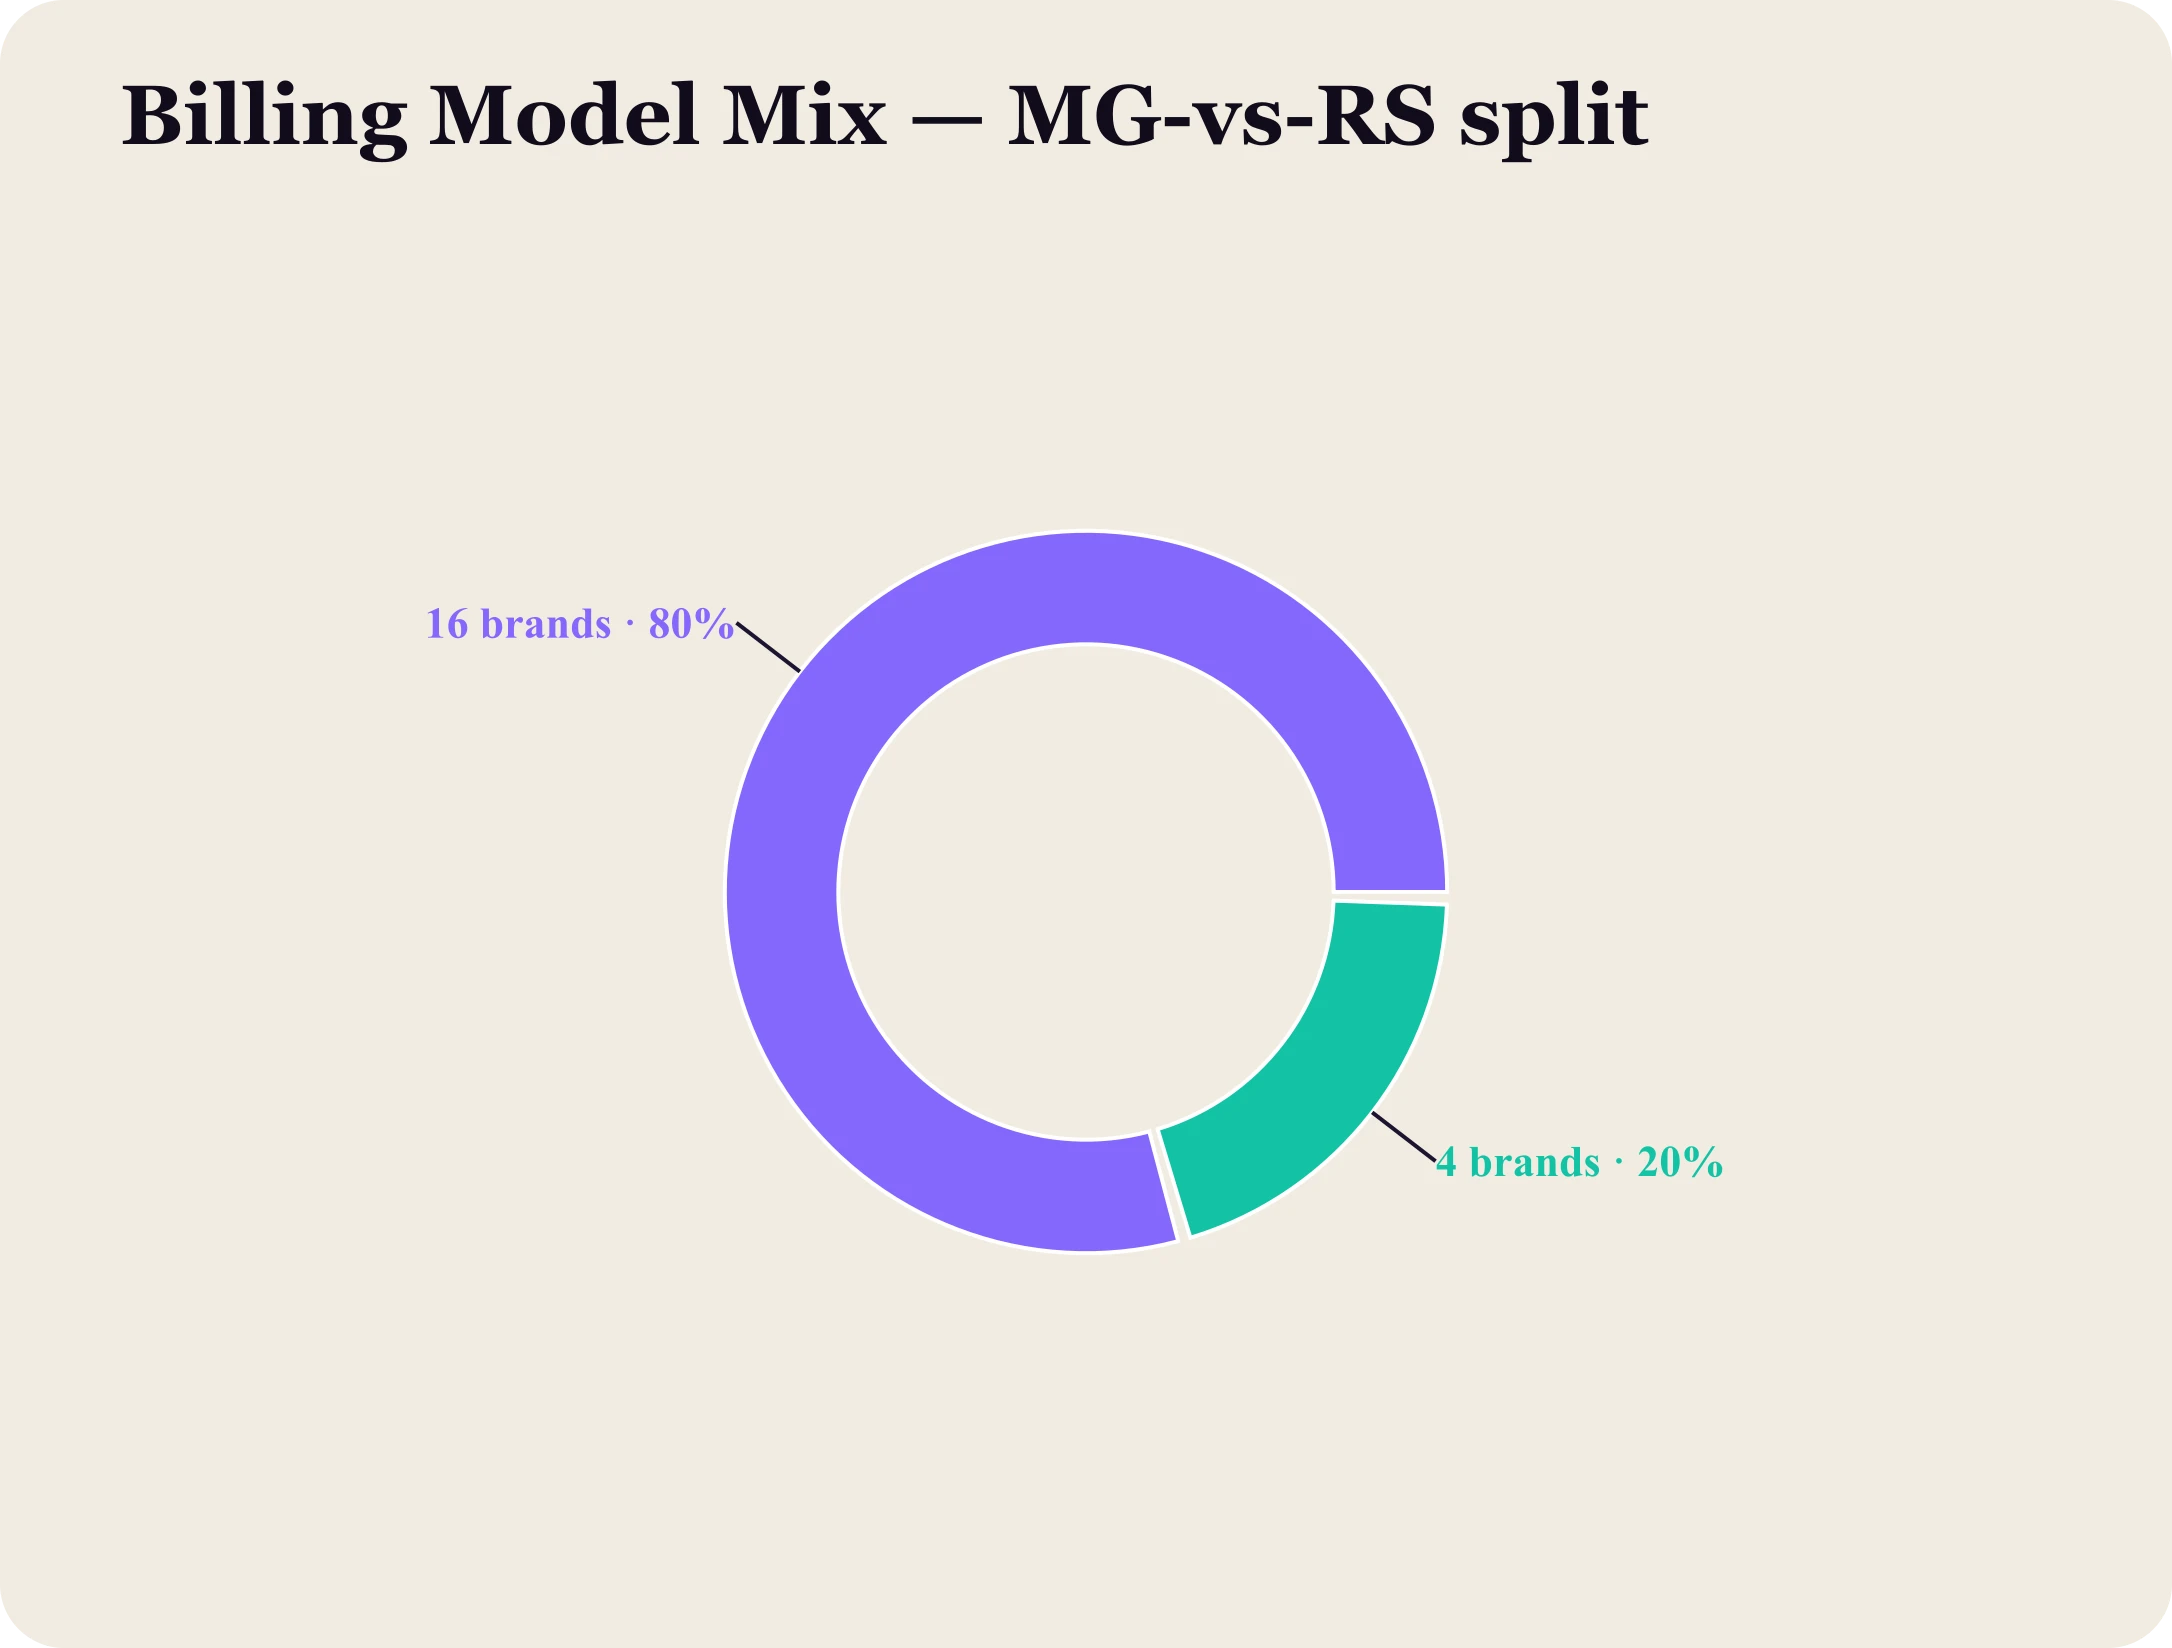
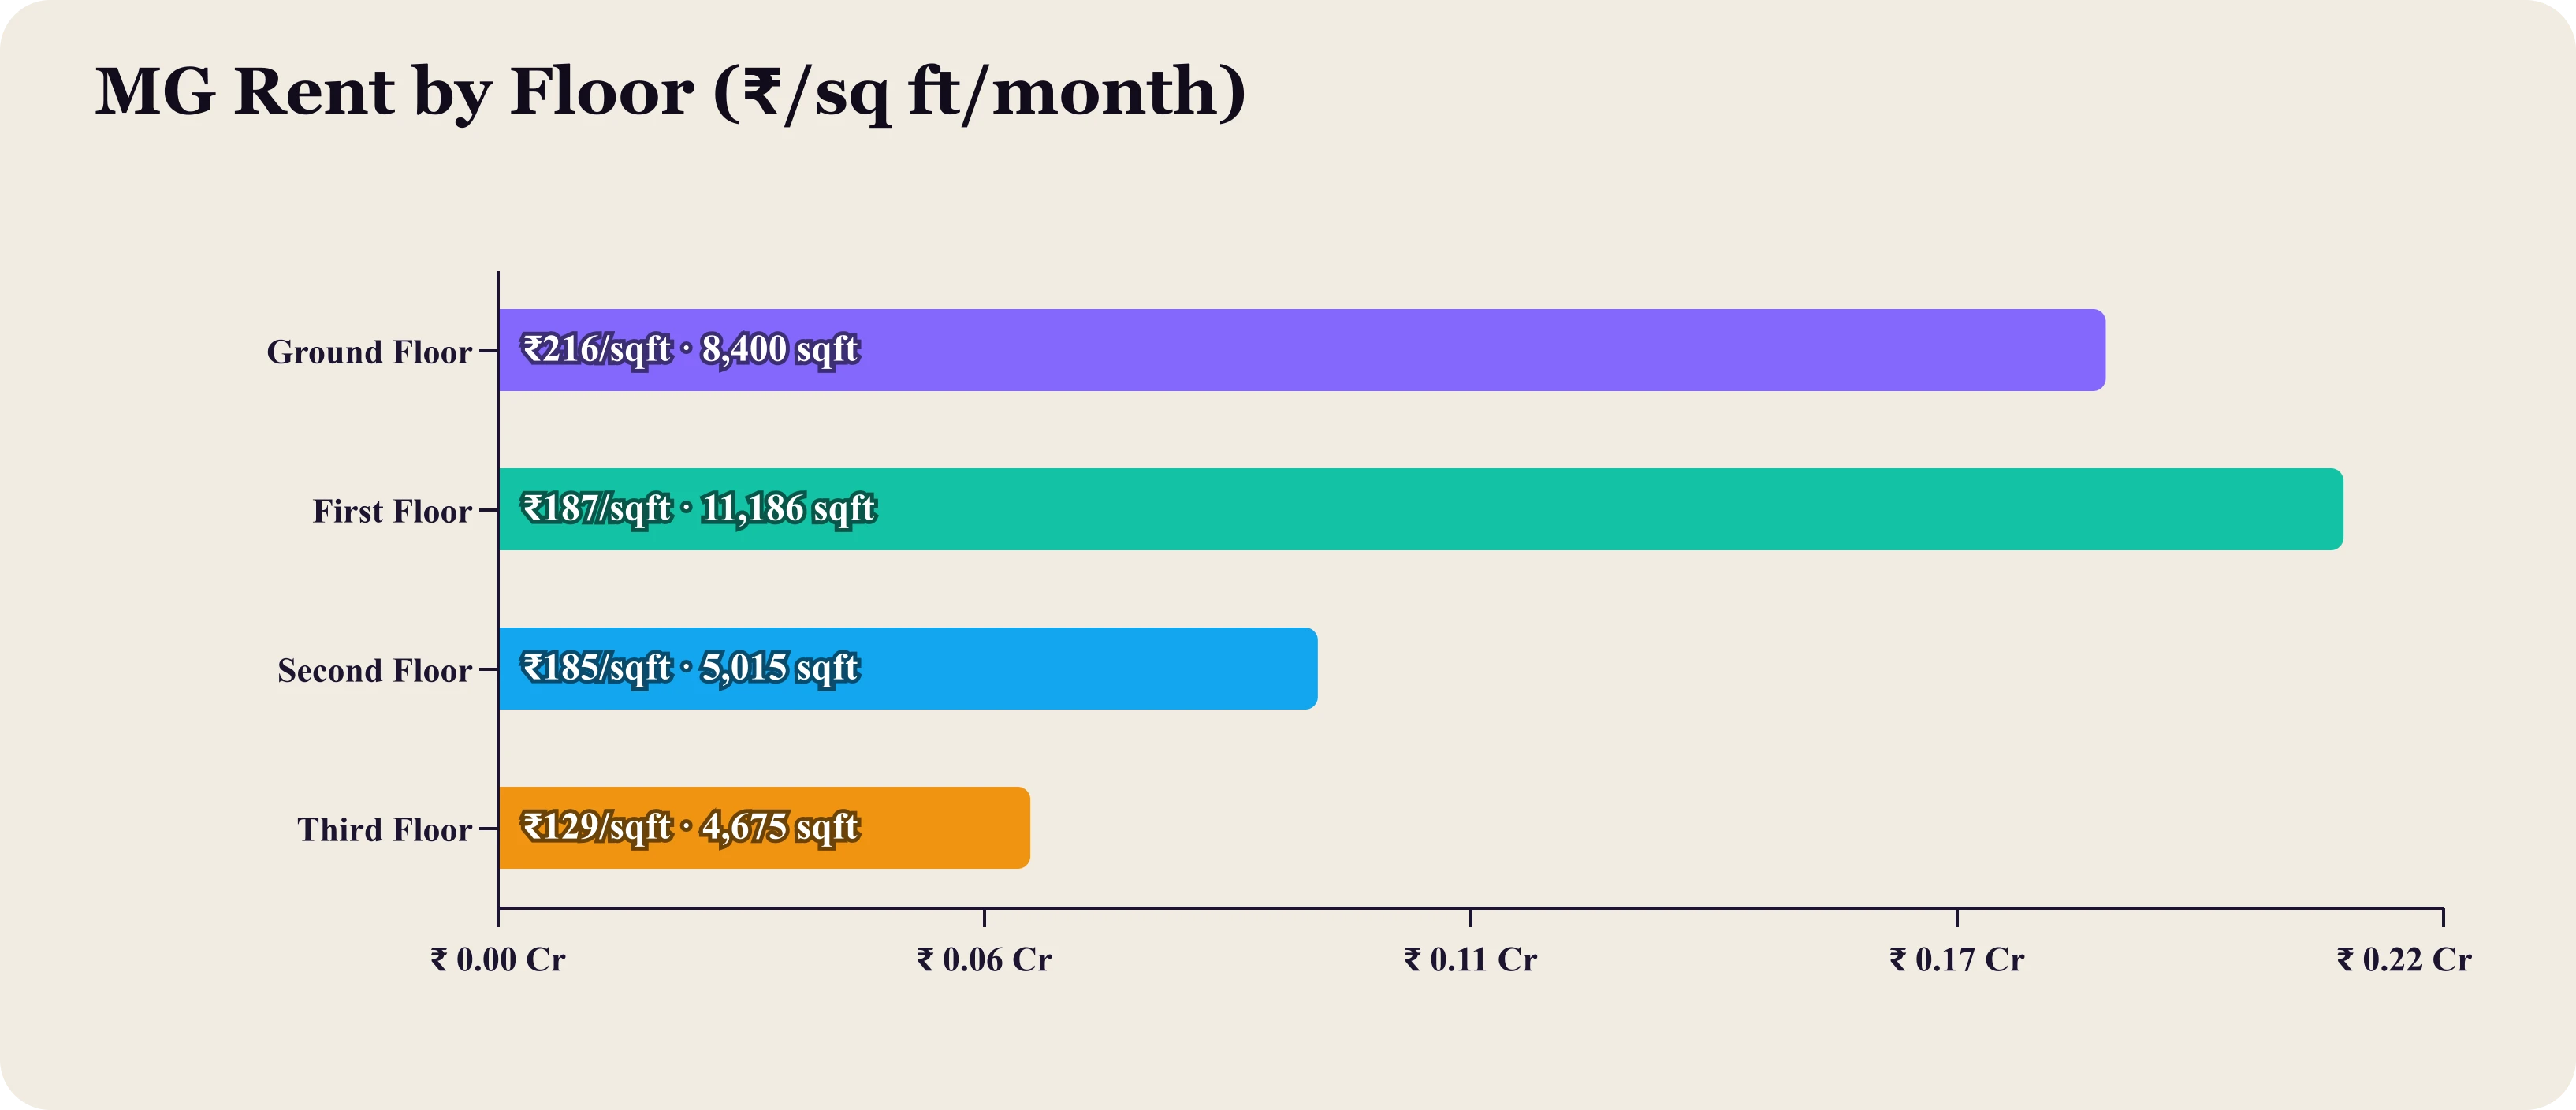
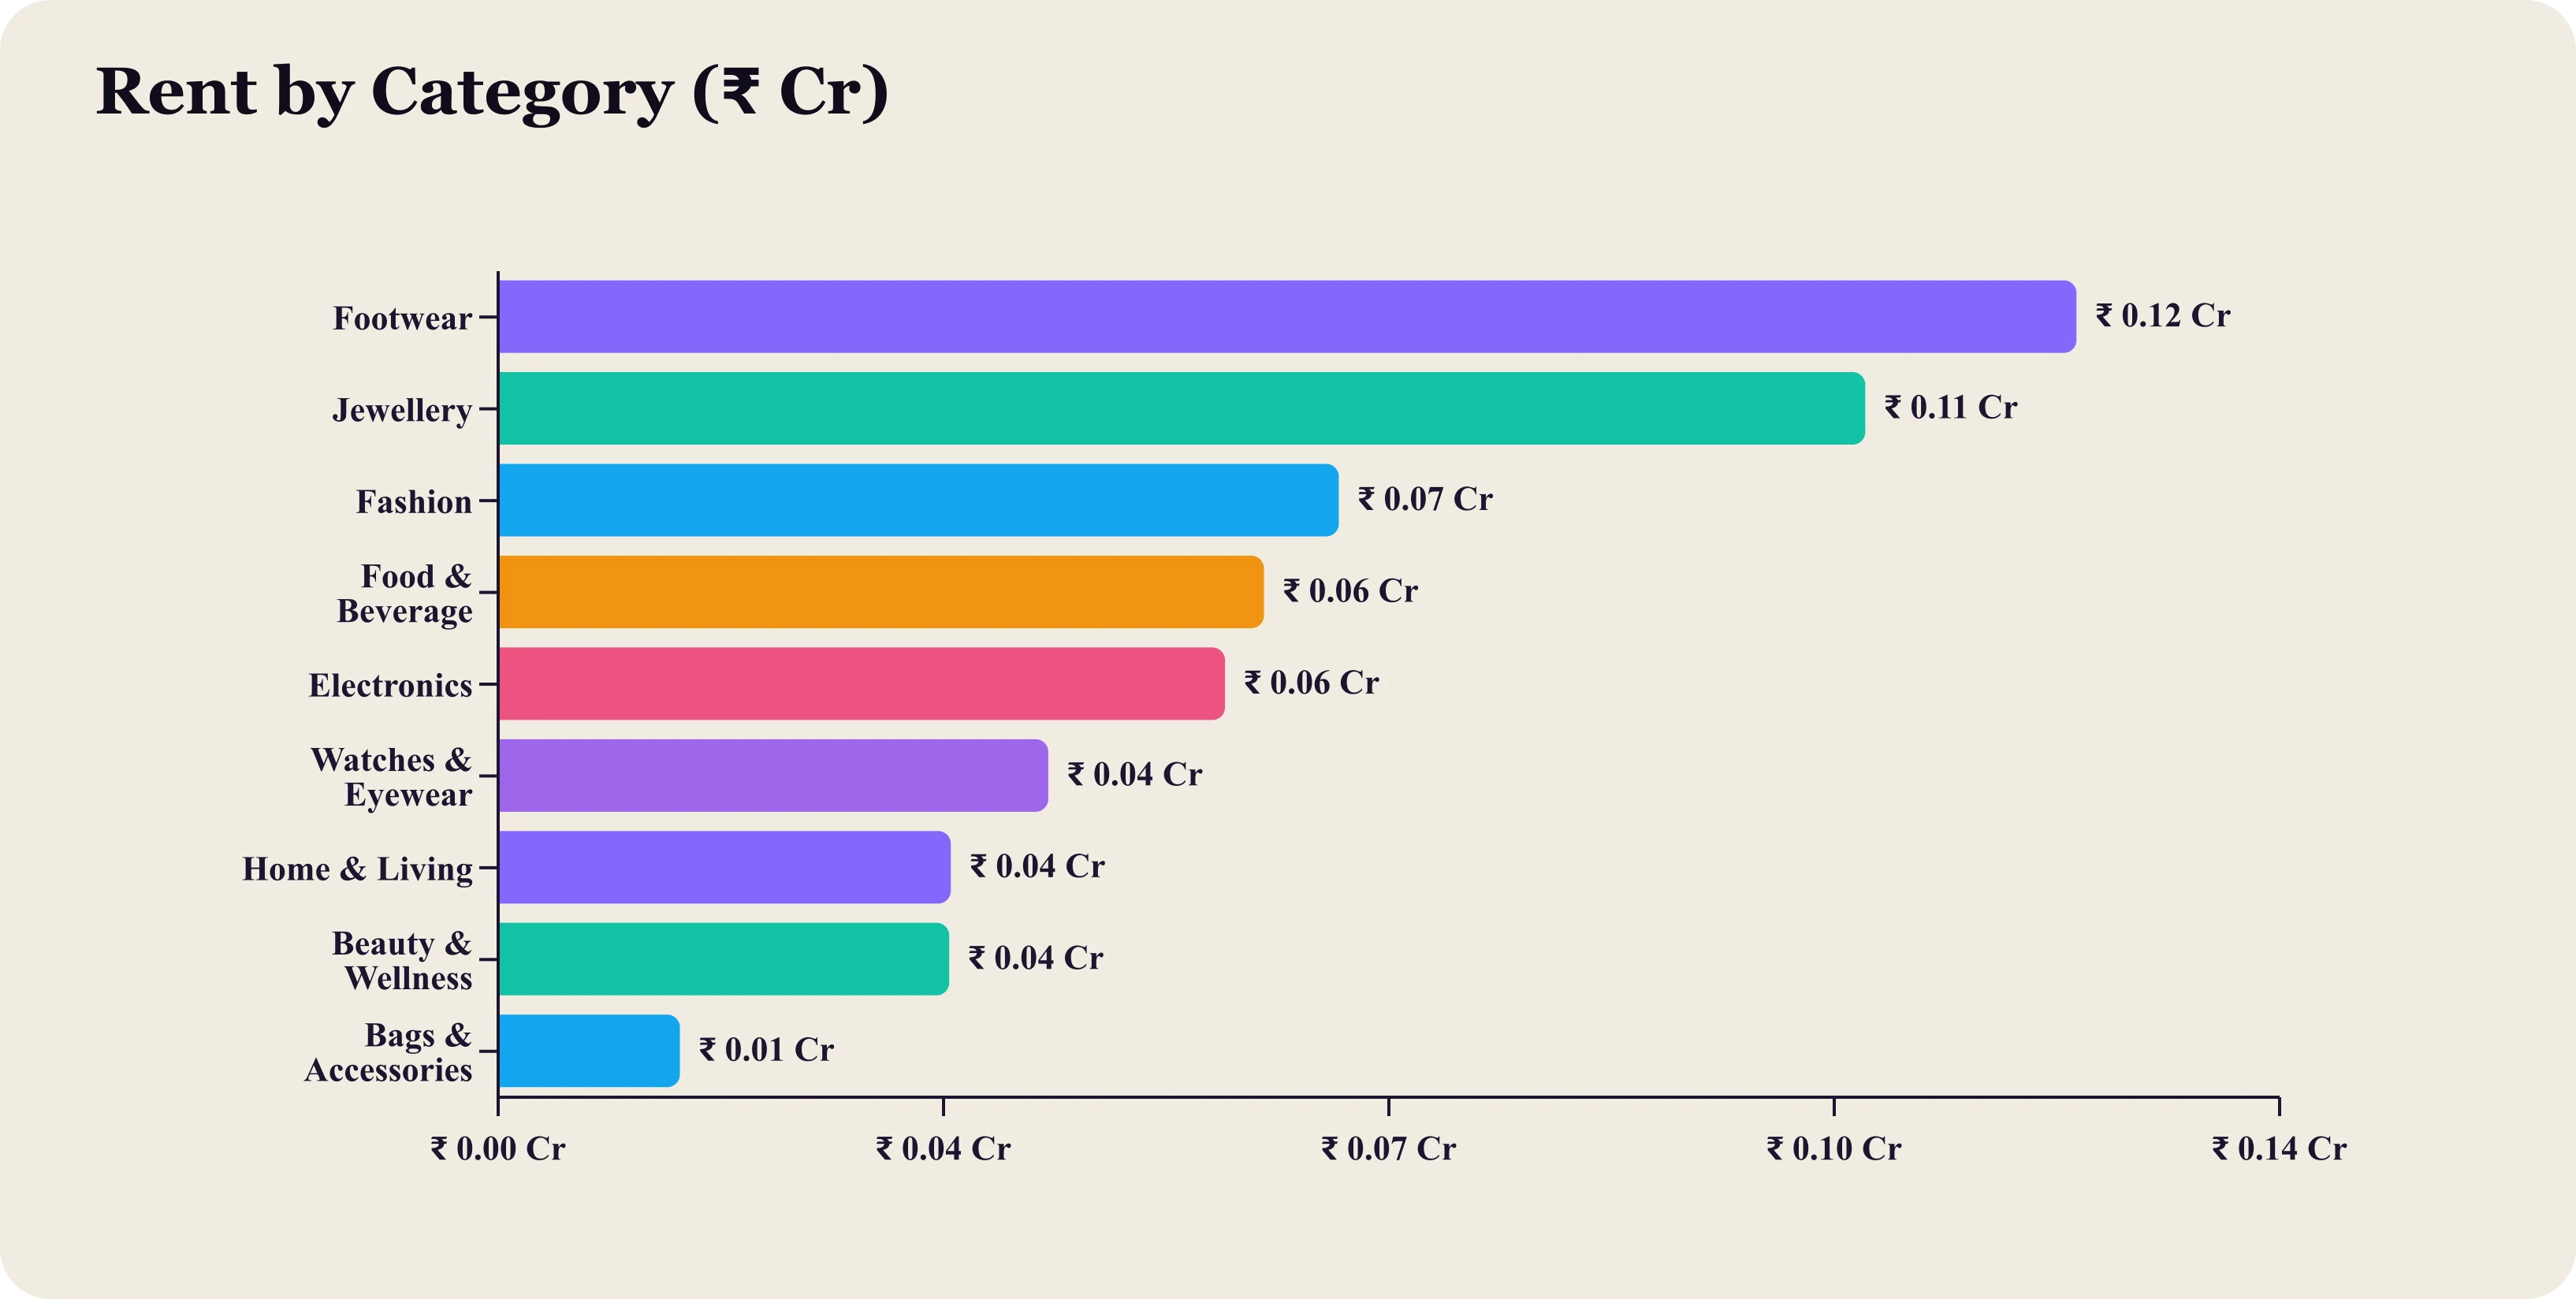
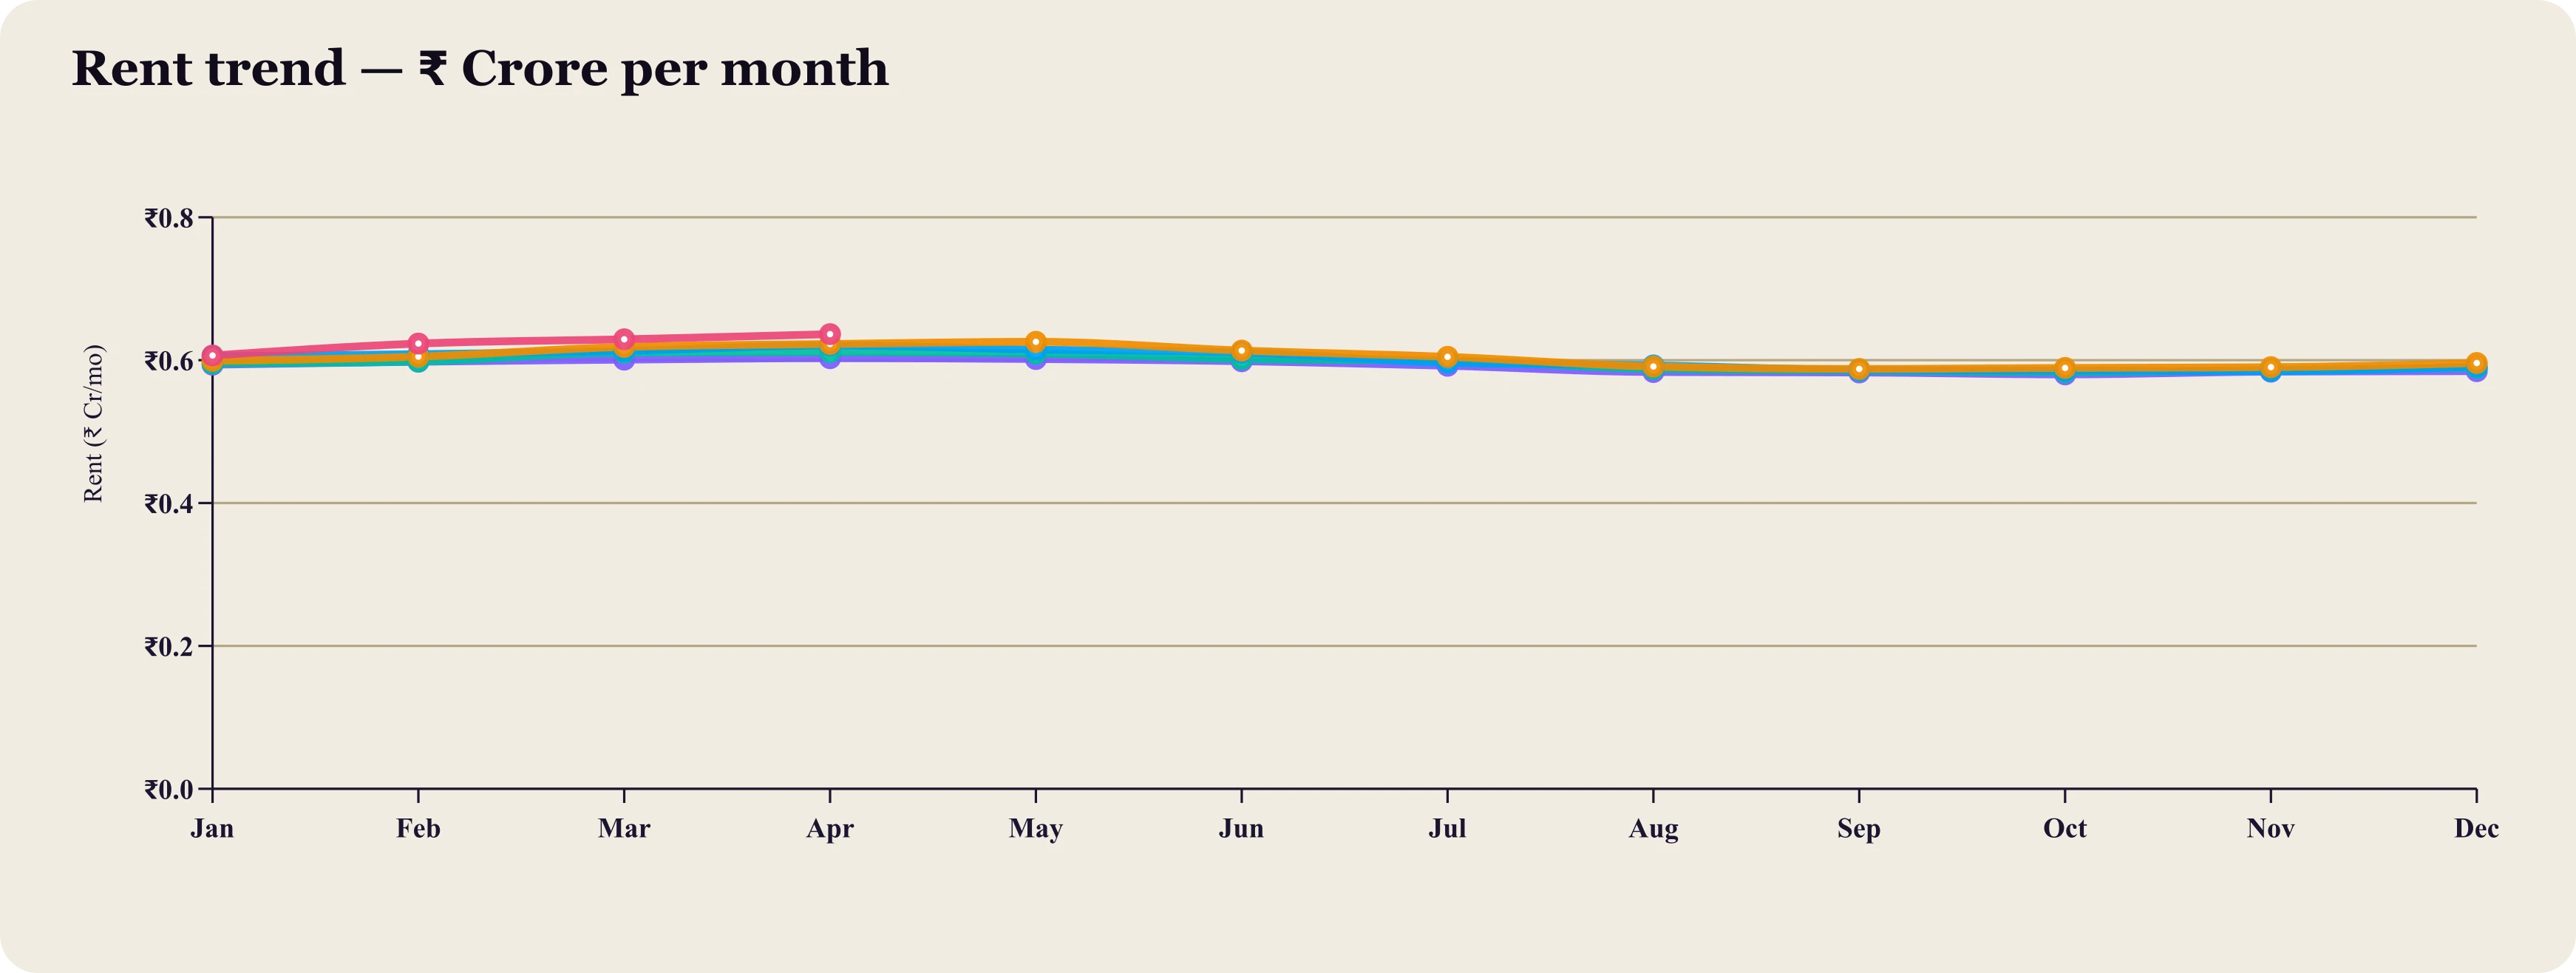
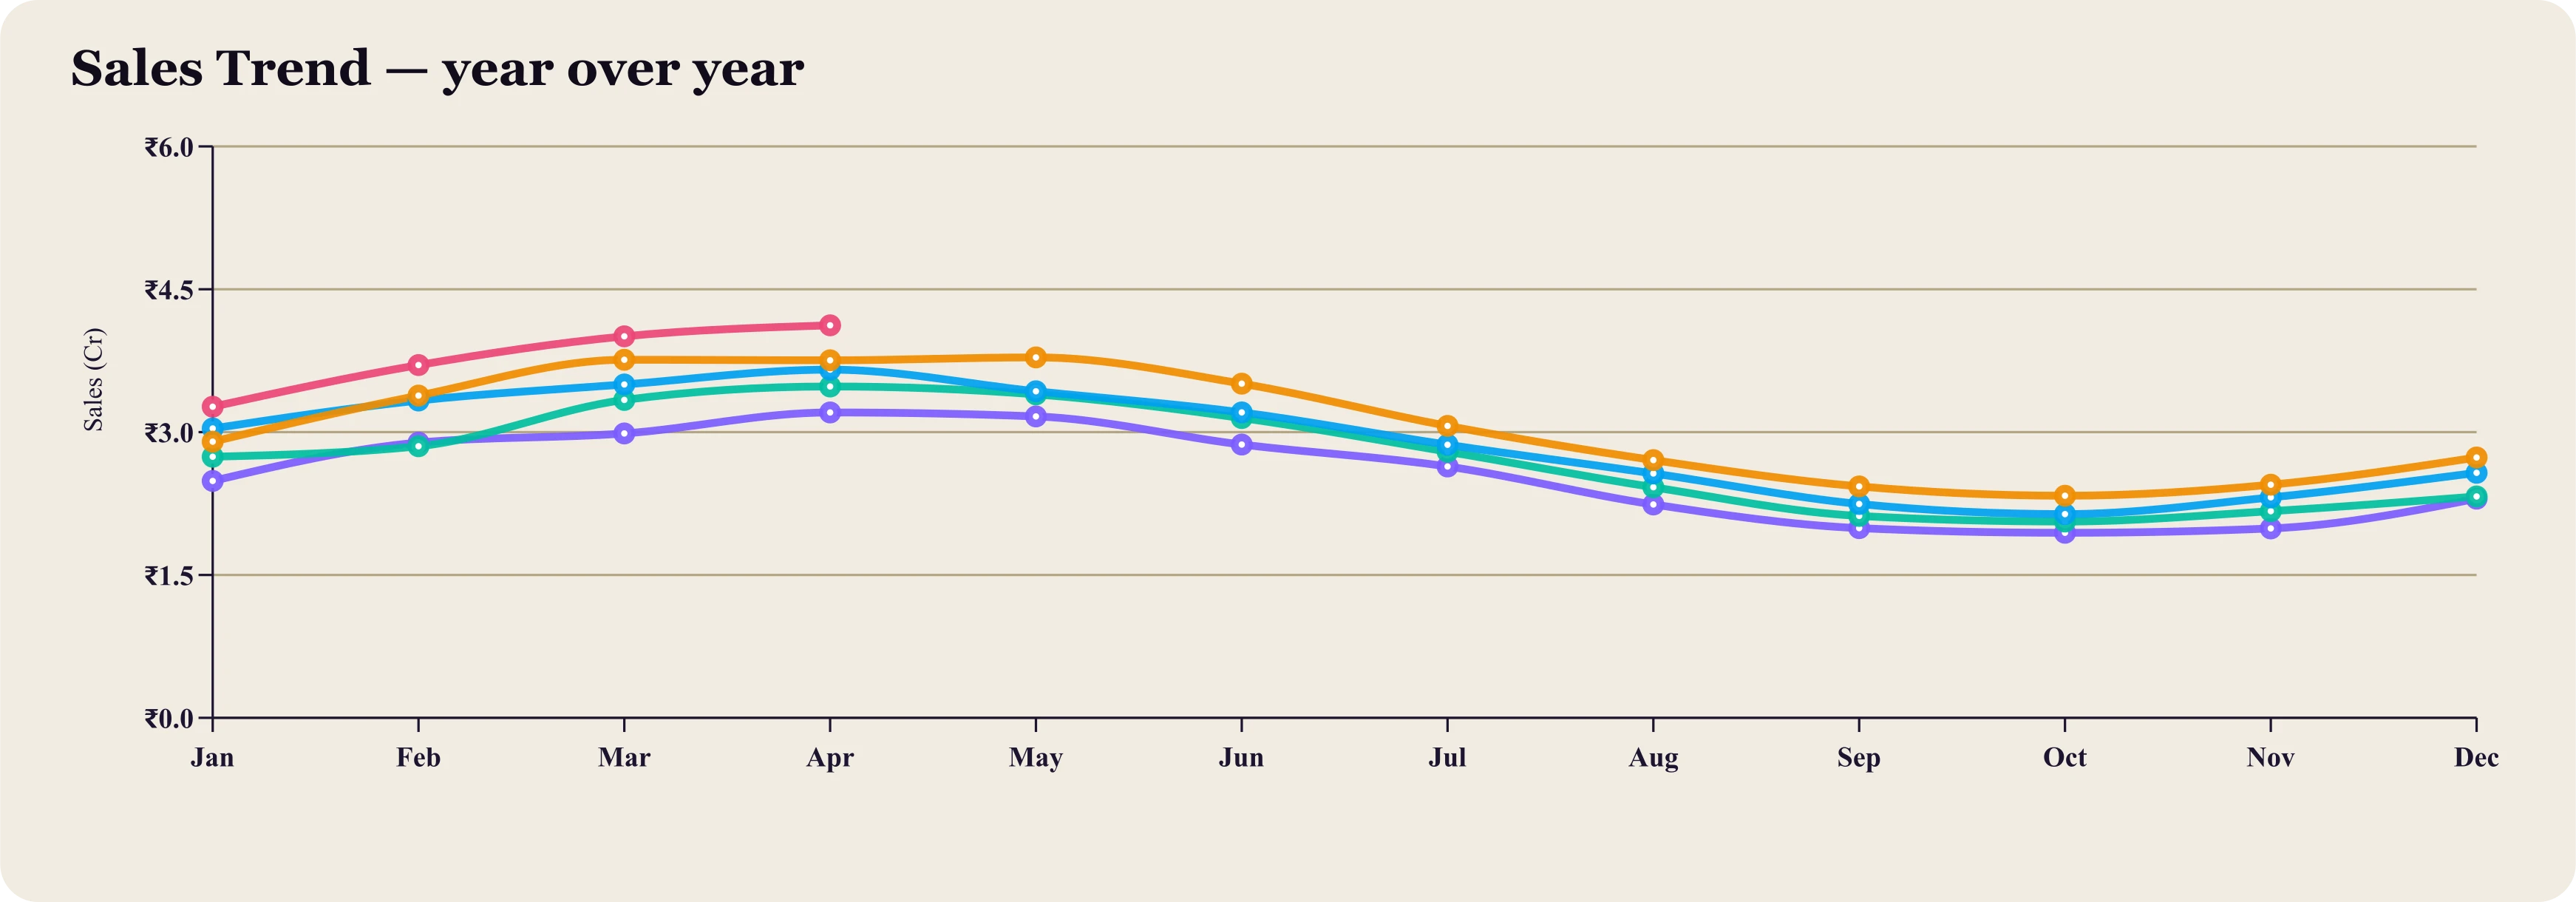
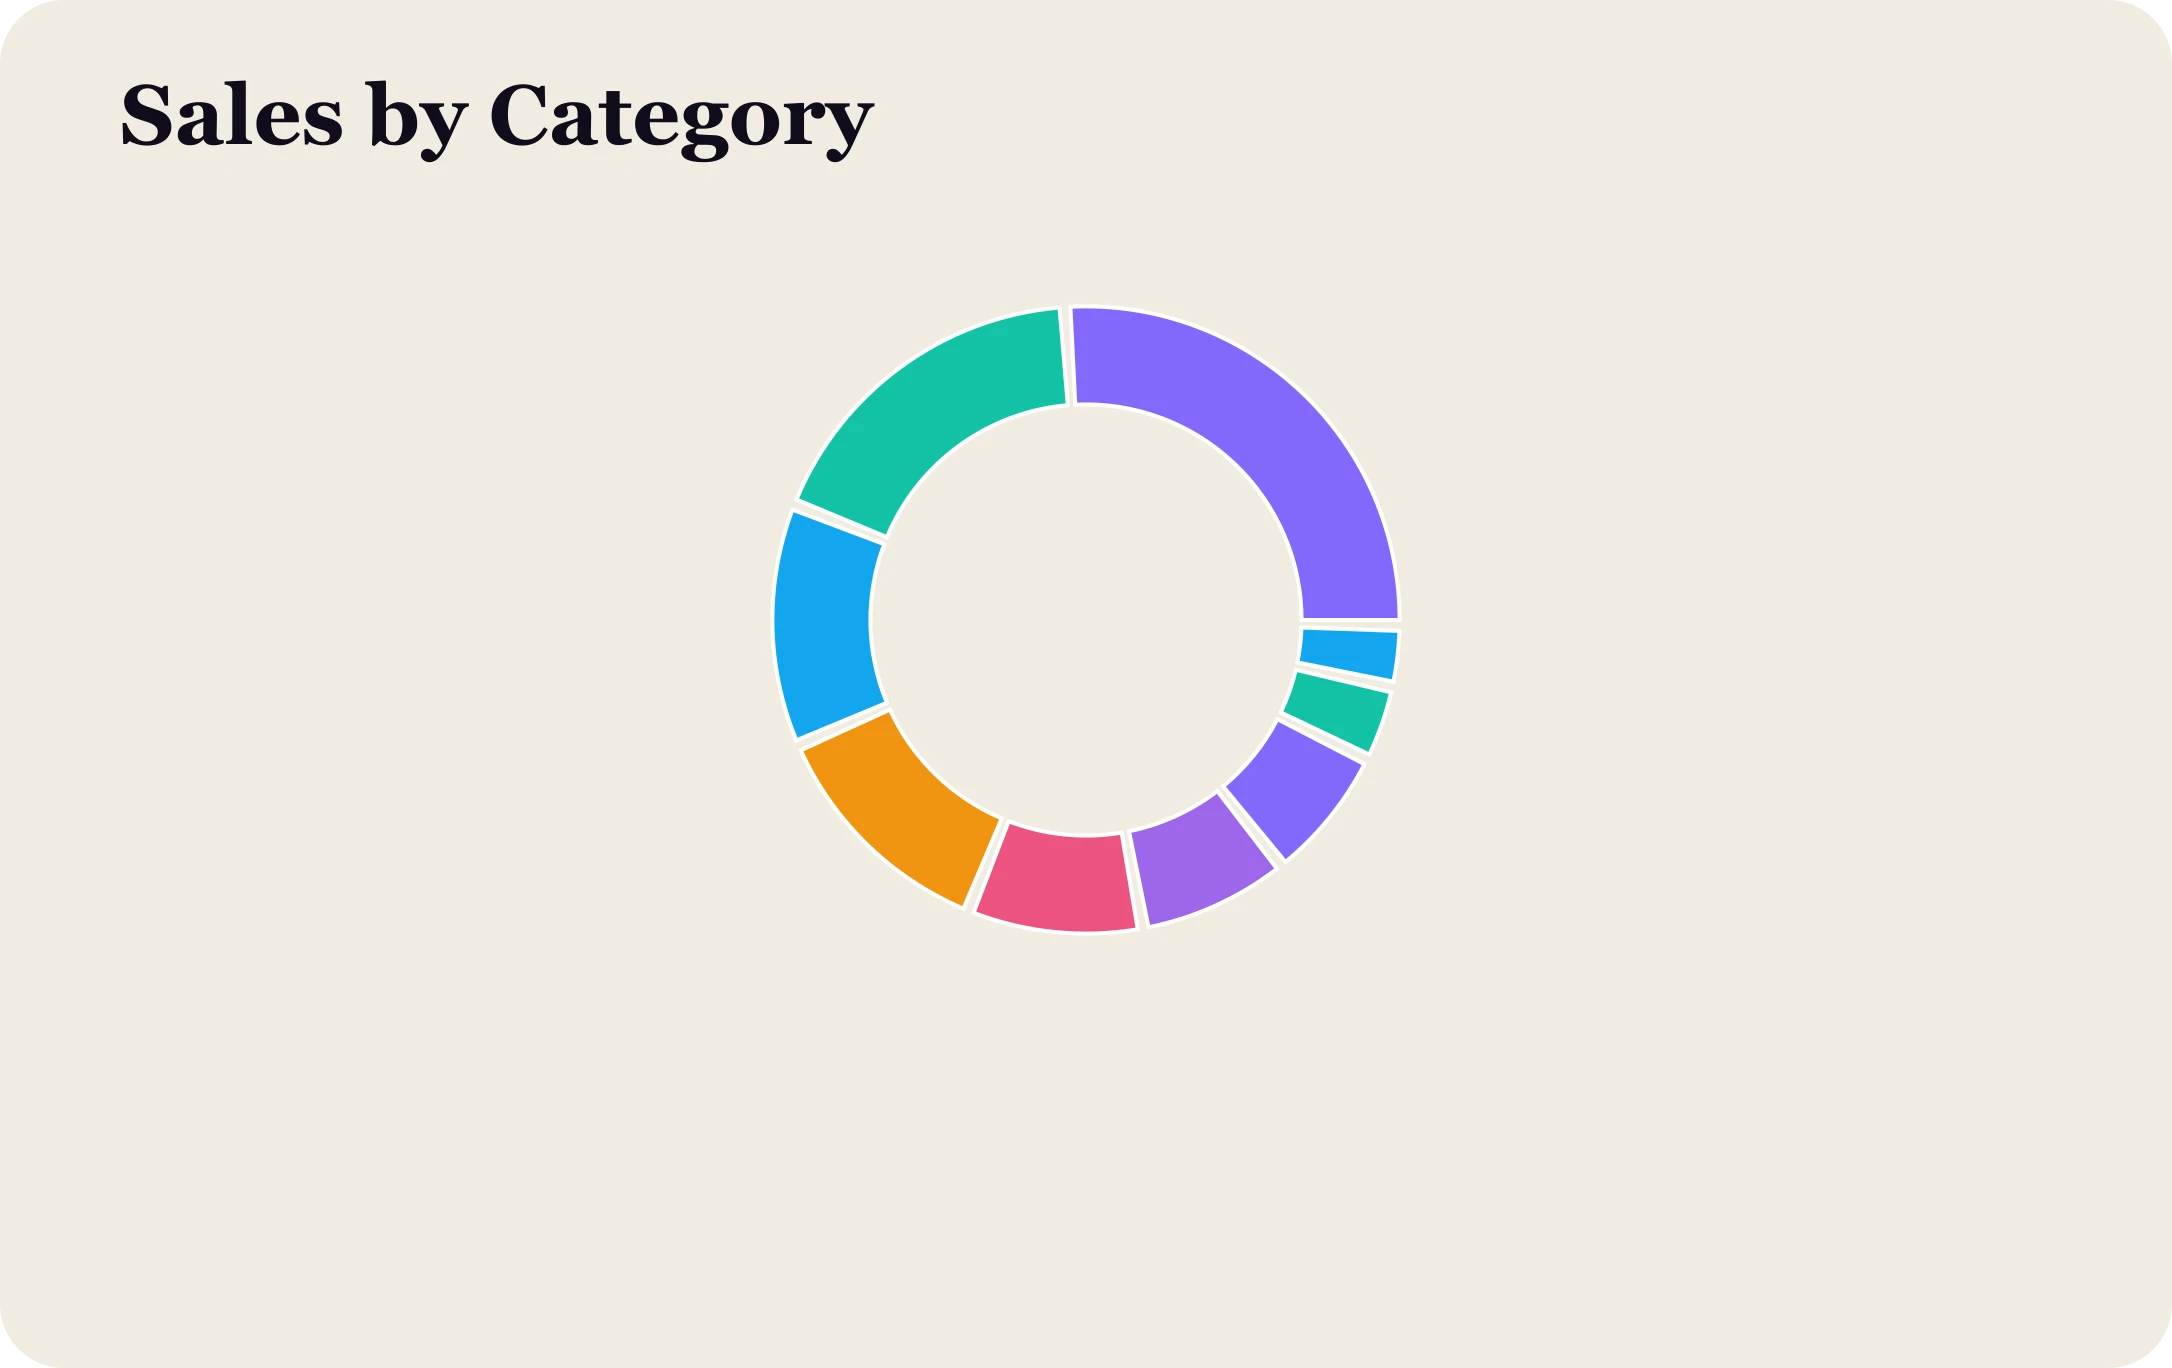
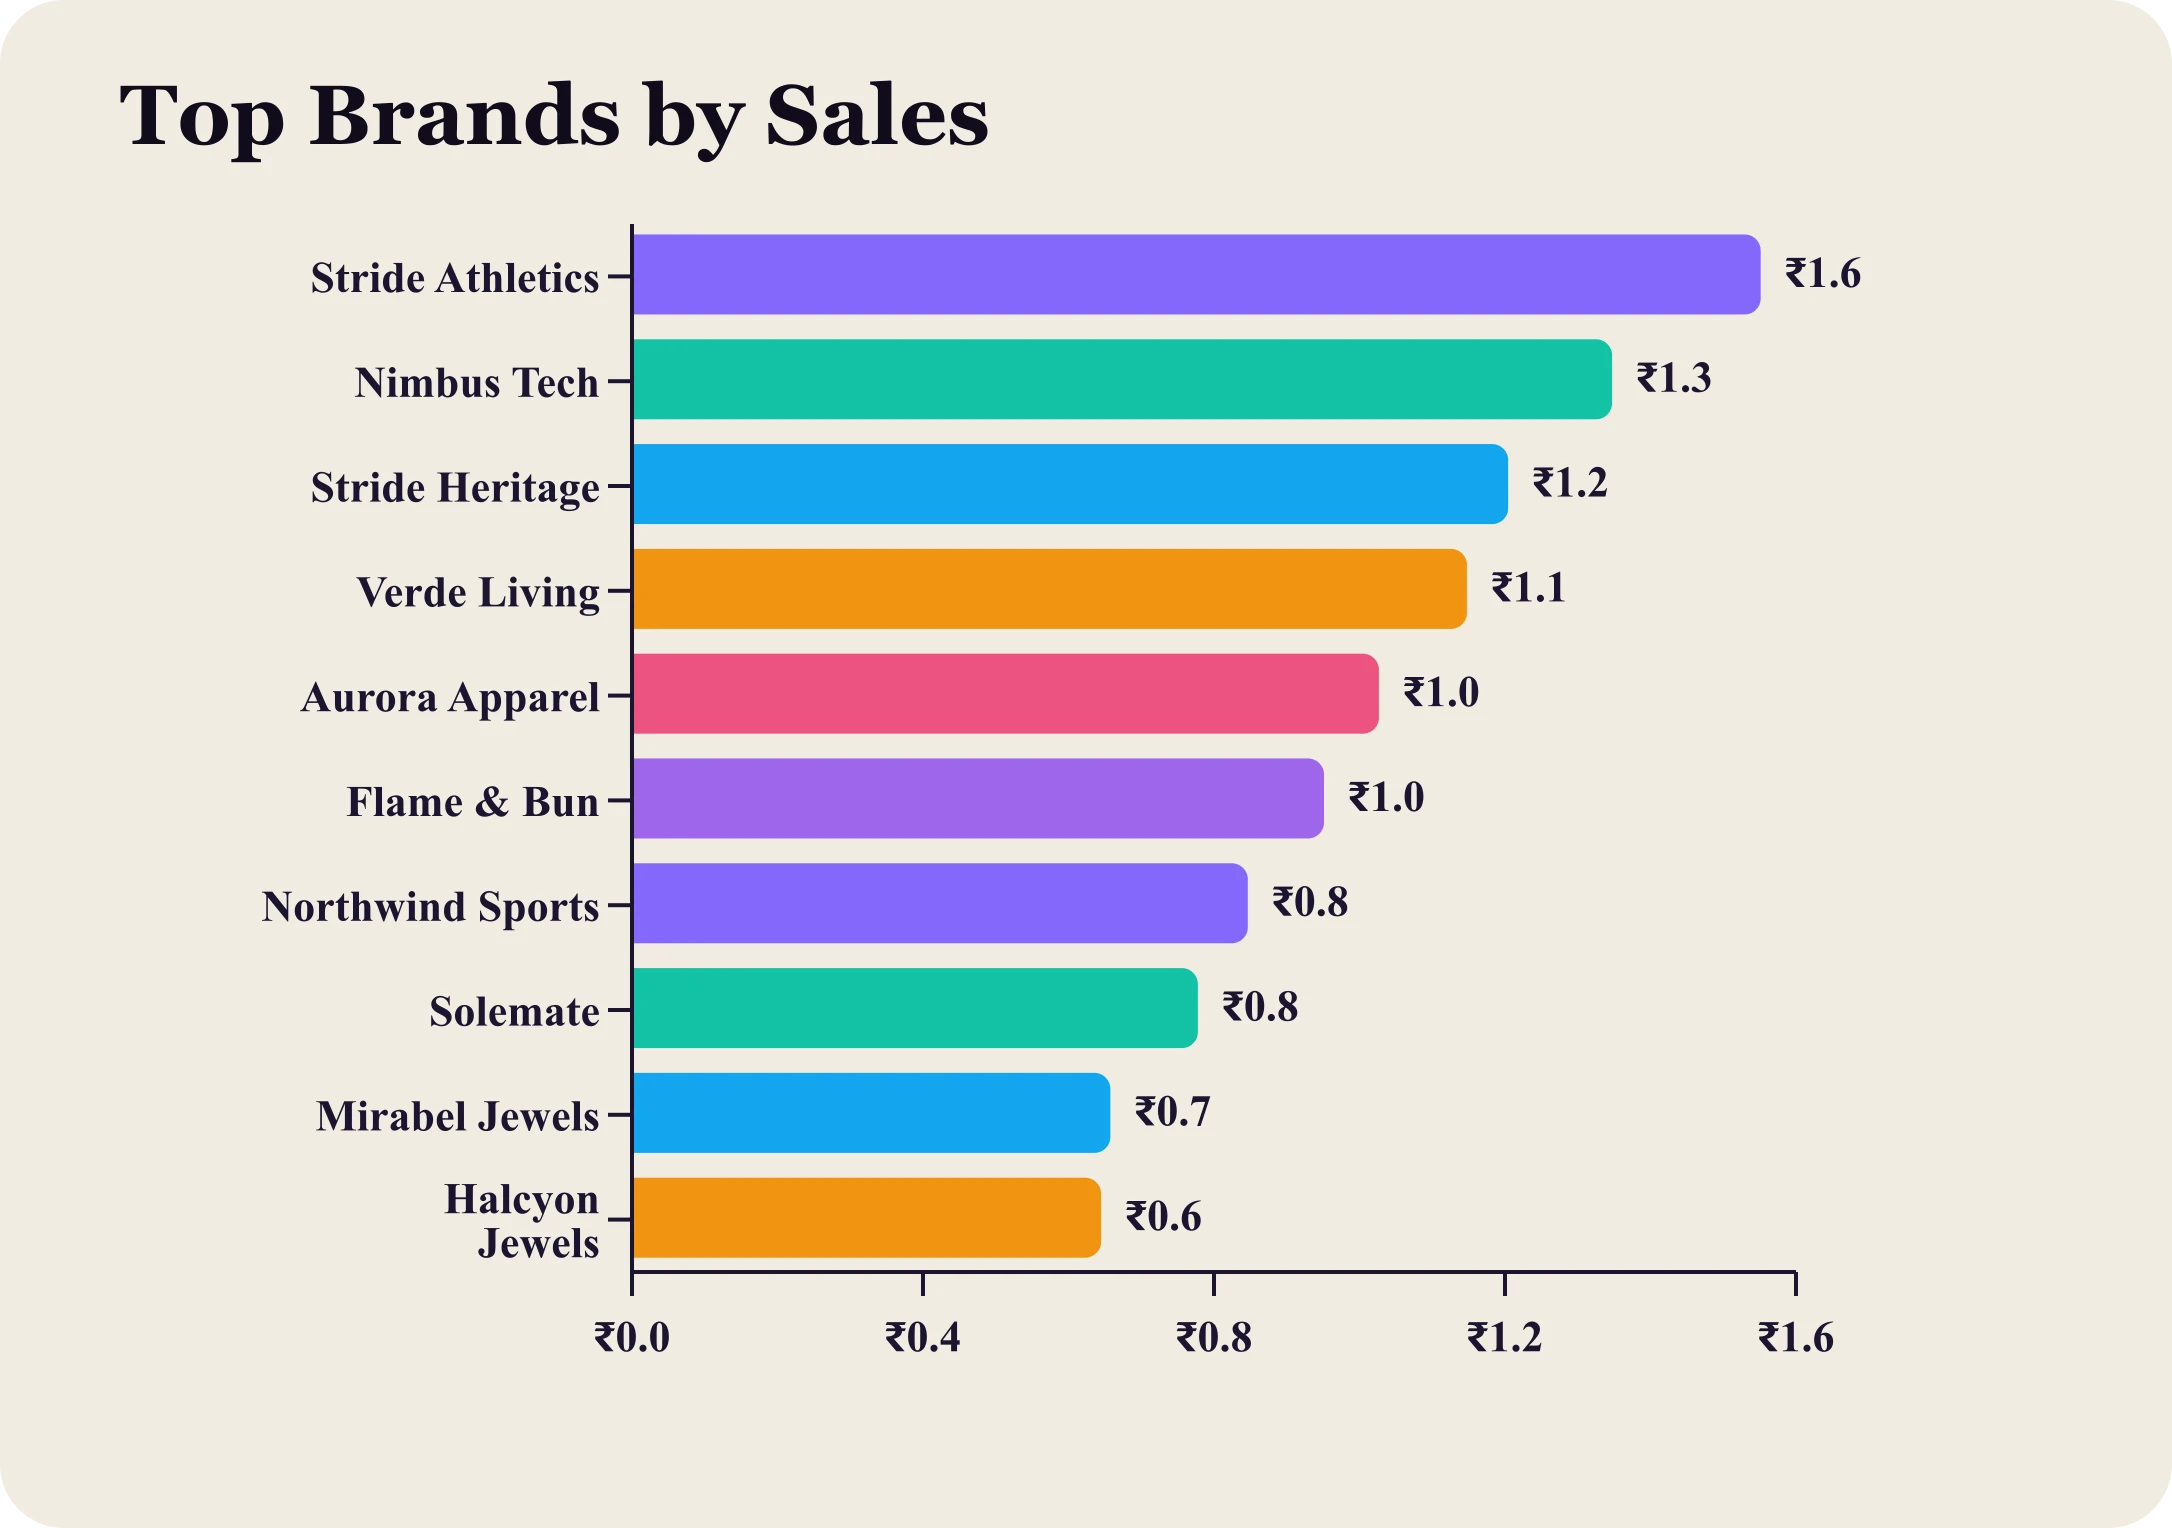
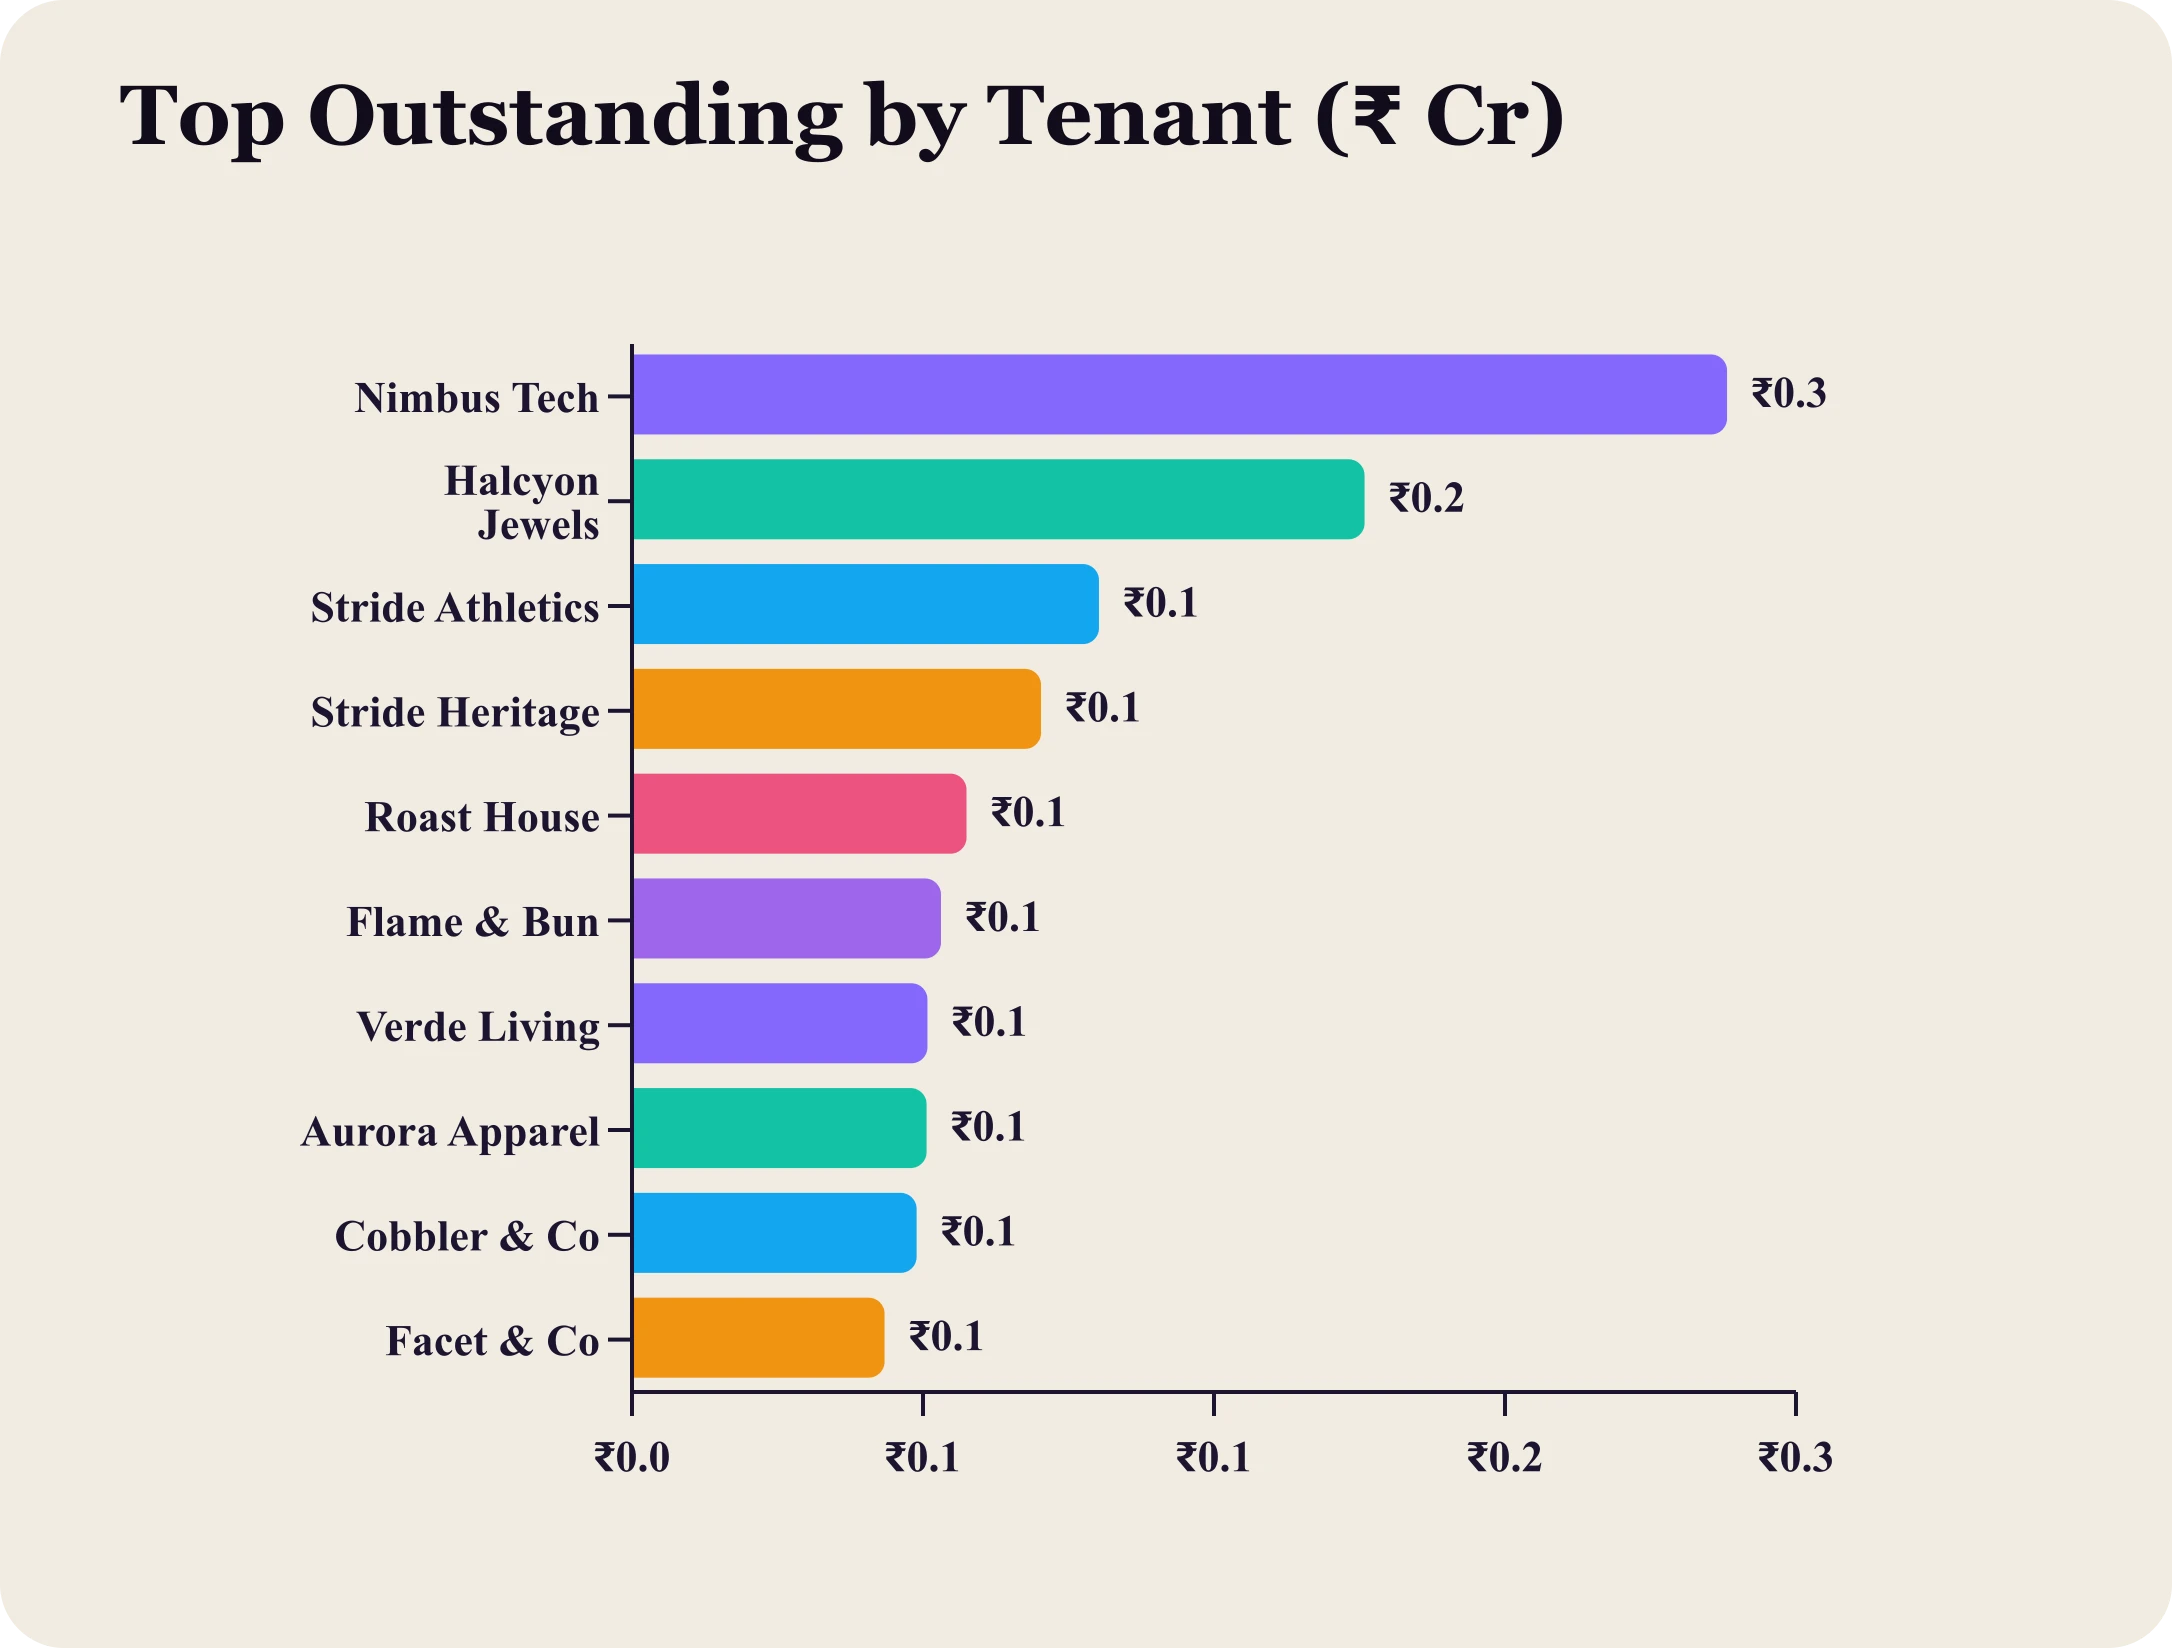
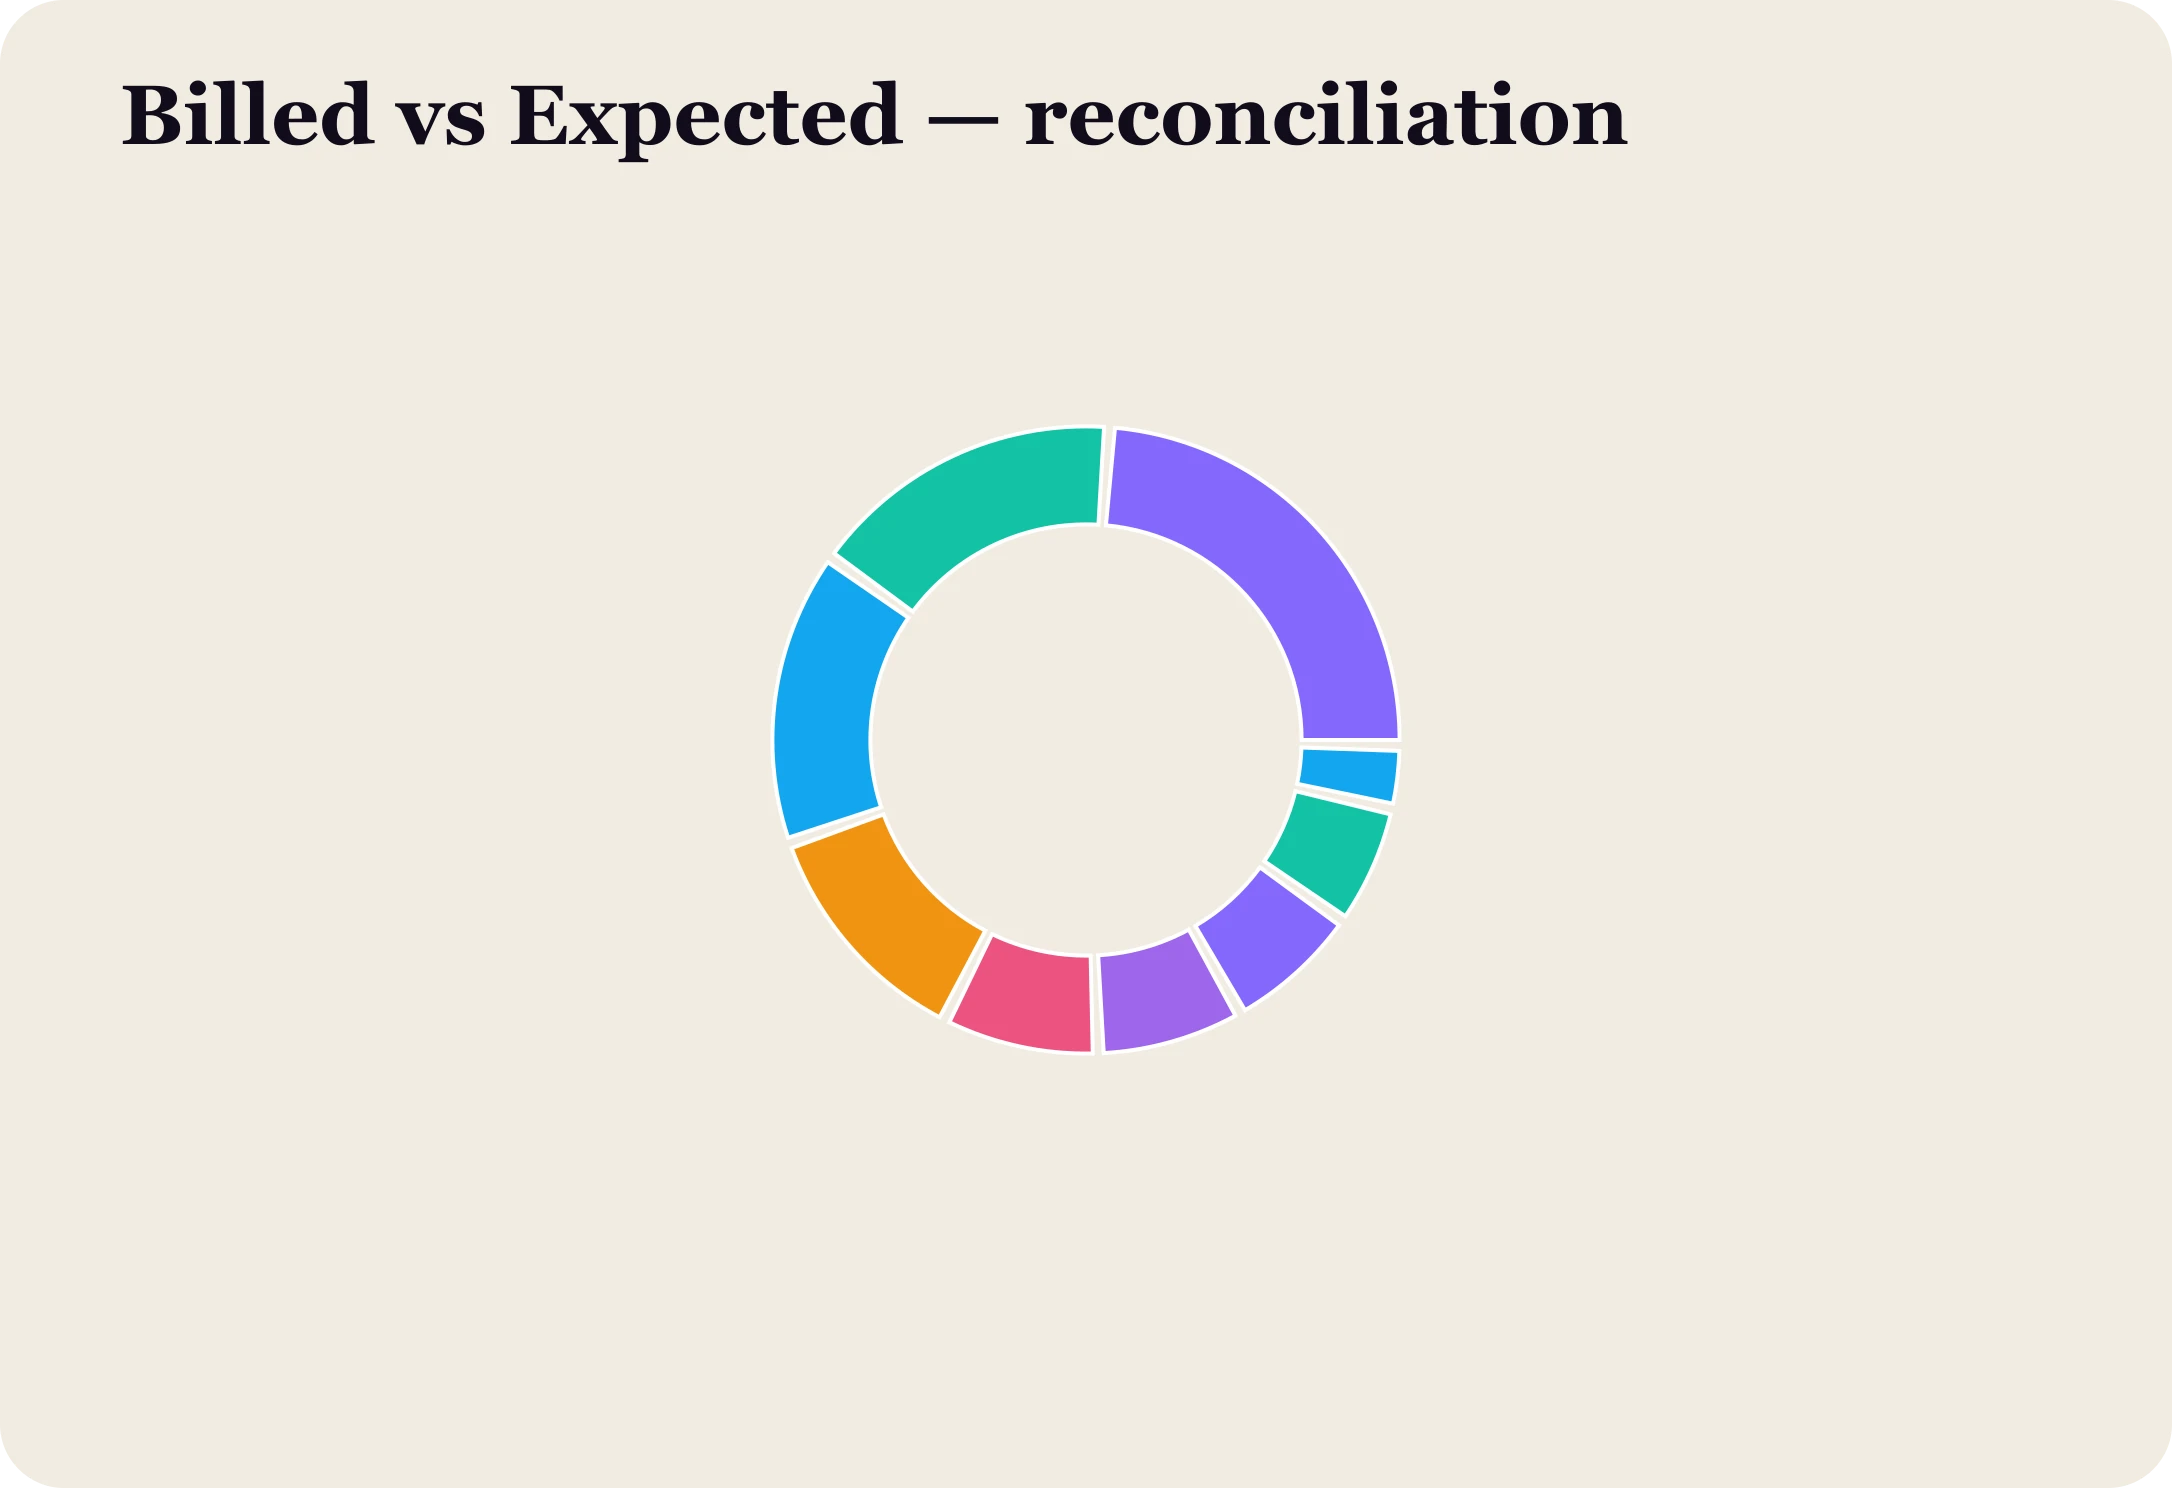
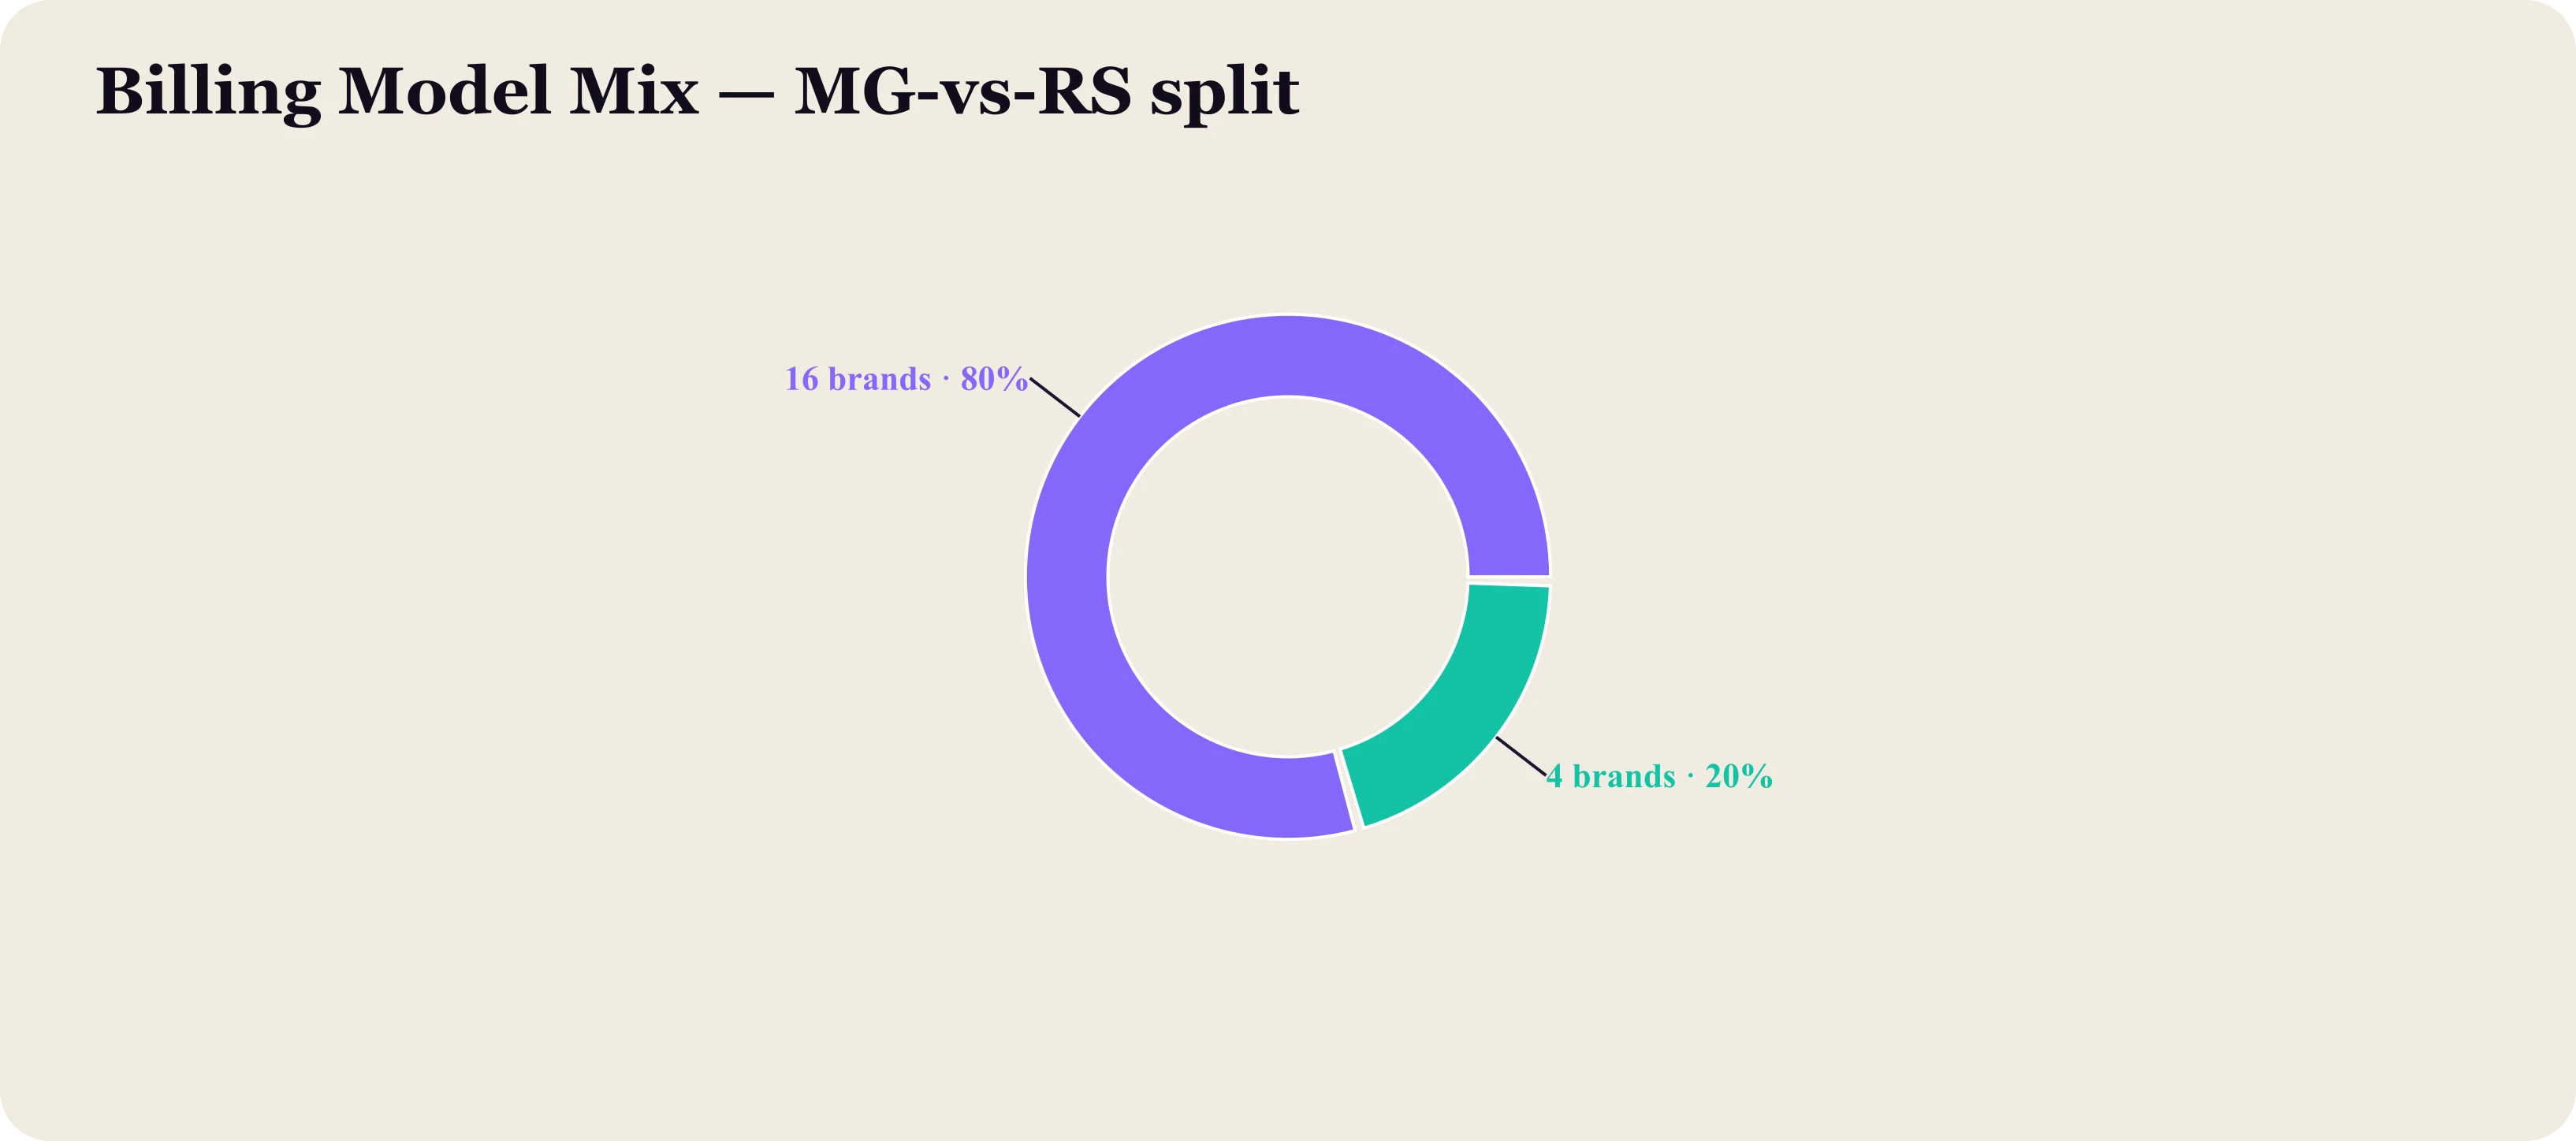
Headline KPIs, trend, category split and a top-brands ranking — all responsive to two global slicers that filter every widget at once.
The landing screen stitches together the crux of every accessible module. Unbuilt modules appear as clearly-labeled coverage tiles, so the page doubles as a live map of the whole system. Clicking a company in the ranking refocuses the KPIs onto that entity.
Business Problem
Leadership had nowhere to see overall performance without manually reconciling several spreadsheets.
Solution
A server-rendered summary pulling pre-aggregated, cached data from every section through one filterable view.
- Global Unit + Brand slicers
- KPI cards with period deltas
- Sales & footfall trend line
- Category split + brand ranking
- Module-coverage tiles
- Click-to-focus on a company
My Role
Designed the information architecture and built the aggregation loaders and global slicer state.
Challenge
Composing one fast, permission-aware screen from many independently-cached sections.
Outcome
A single authoritative view that replaced multi-spreadsheet consolidation as the daily starting point.