Executive BI · Case Study

Unified Enterprise
Analytics Portal

A framework-free, dependency-light portal that ingests messy departmental spreadsheets and live Google Sheets, auto-parses them through a library of intelligent domain parsers, and renders eleven interactive executive dashboards behind role- and department-scoped access.
Full-stack + Data Engineer Node.js · Express Vanilla JS · Chart.js · Leaflet node:sqlite Live Google Sheets
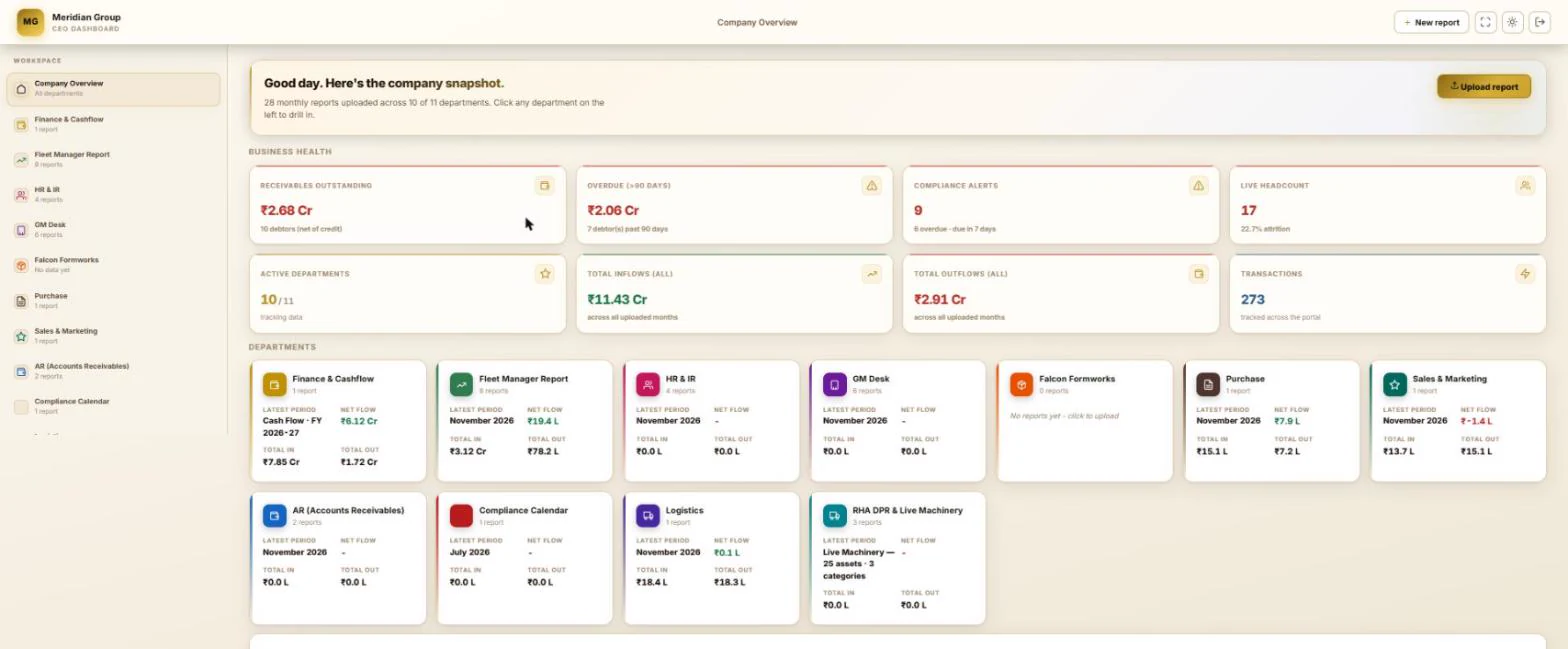
meridian-group · CEO Dashboard
Executive analytics dashboard showing business-health KPIs and eleven department status cards.
Industry
Diversified Enterprise / Multi-Sector — infrastructure & equipment-fleet operations
Project Type
Internal executive reporting & BI portal
My Role
Sole full-stack + data engineer, end-to-end
Core Stack
Node · Express · SQLite · Chart.js · Leaflet · vanilla JS
The problem & the solution

From a month-end spreadsheet ritual to always-on intelligence

The Business Problem

Leadership reconciled a dozen departmental workbooks by hand every month — cash, receivables, fleet P&L, payroll, compliance, field machinery. Answering a simple question ("how much are we owed, what's overdue, are we compliant?") meant opening several spreadsheets from several people, with no single, current, comparable view.

The Solution

One sign-in portal where every department's report — uploaded or live from Google Sheets — is auto-parsed by a content-aware engine and rendered as interactive, faceted analytics. Non-technical staff drop a workbook and a dashboard appears; the highest-velocity data flows in automatically. Access is scoped per department, fail-closed.

Ten worked sections

Every department, its own purpose-built dashboard

Each section below is generated from real spreadsheets or live sheets by a dedicated parser, then rendered as a bespoke dashboard. Click any screenshot to enlarge.

More views

Gallery

How it was built

Process

Under the hood

Technologies

Back end

  • Node.js ≥ 23.4 — for flag-free built-in SQLite
  • Express 4 — ~31 REST endpoints
  • Multer — in-memory multipart uploads
  • SheetJS / xlsx — spreadsheet parsing & preview
  • node:sqlite — built-in DB, no ORM, no native build
  • crypto — HMAC sessions & RS256 JWT

Front end

  • Vanilla JavaScript — global state + render fns
  • Chart.js 4 — area/bar/line/donut charts
  • Leaflet — geospatial fleet map
  • CSS custom properties — light/dark design system
  • No framework — deliberately dependency-light

Integration & infra

  • Google Sheets / Drive — zero-dependency client
  • RS256 JWT — service-account auth from scratch
  • Render.com — deploy, SQLite on persistent disk
  • Versioned parsers — safe, idempotent re-parsing
  • Clean layering — parse · persist · transport · present
The hard parts

Challenges

Impact

Results & outcomes

In closing

Conclusion

The Unified Enterprise Analytics Portal shows how far a deliberately lean, framework-free stack can go when engineering effort is concentrated where it matters: a resilient ingestion layer and a genuinely useful presentation layer.

By treating the messy reality of departmental spreadsheets as a first-class problem — content-aware parsers, versioned and idempotent, that tolerate layout drift — the platform turns the artefacts an operations team already produces into live executive intelligence, with no change to how those teams work. Live Google-Sheets integration built with zero extra dependencies keeps the most important numbers current, while fail-closed department scoping keeps the right information in front of the right people.

Skills demonstrated
Full-stack engineeringData engineering / ETL Intelligent document parsingREST API design Auth & RBAC + scopingGoogle Sheets / OAuth / JWT Data visualizationSQL / embedded DB Entity resolutionUX & responsive design Dependency-minimal architectureCloud deployment
Enlarged screenshot